Condition Criticality and Risk Assessment
When standing up a new T&D asset management function, a common starting point is a third-party gap assessment and a multi-year plan for implementation. Where to go next is not always so clear. A concrete step forward in executing the plan is development of Condition, Criticality, and Risk Assessment (CCRA) models for key asset classes. These models paint a picture of asset-level risk and provide support for a wide range of the decisions asset managers are faced with. They can serve as the foundation of an asset management program. BIS Consulting, with our clients, has developed and refined the CCRA approach over two decades, and our clients have applied CCRA models to all major asset classes in T&D and generation. This article describes the model and its inputs, the development process, and its role in an asset management program.

By Darin Johnson, President of BIS Consulting
The first problems asset managers meet is aging infrastructure. How much should we replace? Which assets? And – a question that is not asked often enough – how do we know when to stop? The CCRA approach addresses these questions, finding the right strategy for each asset, then rolling those results up to the population and ultimately to the spending plan. Here is the concept.
When deciding whether or not to replace an aging asset, we face competing incentives. On one hand, we’d like to wait as long as possible, minimizing capital spending by extending service life. However, the longer we wait the more risk we’ll face as assets degrade and become more likely to fail. There is a service life that minimizes total cost and is the optimal economic life for that asset.
Optimizing Service Life Duration by Minimizing Life-Cycle Cost
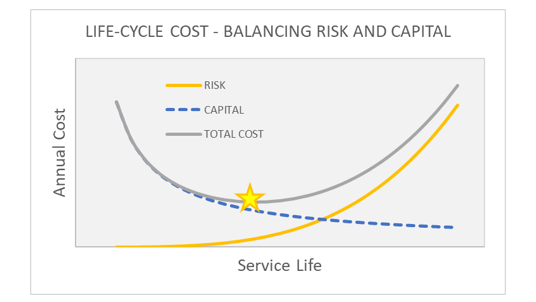
Optimizing the life-cycle cost of an asset requires balancing the trade-off between the benefit of delaying capital expenditures as long as possible (blue) against the increasing risk of failure as the asset ages (gold).
The optimal service life minimizes life-cycle cost. It is asset specific, depending on age and type, but also consequence of failure and cost of intervention.
Optimal economic life is asset specific. We can’t say station transformers have a life of 60 years. We can say only that this transformer has a 60-year life, but that transformer – which is the same construction and age and is in the same condition, but serves different loads and thus has different consequences of failure – has a different life. Also, economic life does not mean that the asset will fail in that year, nor that it will last until that year. It means only that if the asset is still in service when it reaches the end of its economic life, it will be cost-effective to replace it.
The list of inputs needed to perform the calculation is short. We need basic demographics – what have we got, how many, and how old. We need to know what it costs to replace the assets. Then we need to know about risk – probability of failure over time and the consequence cost of failure. Risk is where most of the effort and thought take place.
Probability of Failure
Probability of failure for a given asset class has three drivers. The first is age: older equipment is more likely to fail than younger. The second is condition: more degraded assets fail more often than less degraded ones. The final driver is special factors such as bad vintages, harsh locations (e.g., salt air, corrosive soil), and heavy use such as overloads or frequent starts and stops.
In some cases, owners can produce excellent historical data for fitting failure probability curves. In others, we rely on industry or consultant provided information. The most common approach is a blend of limited, utility-specific historical information and the pooled judgments of subject-matter experts. Sometimes we apply a formal Bayesian approach, but often we estimate curves based on judgment, and then calibrate them to match the utility’s operating history.
Failure Probability Curves for Station Transformers
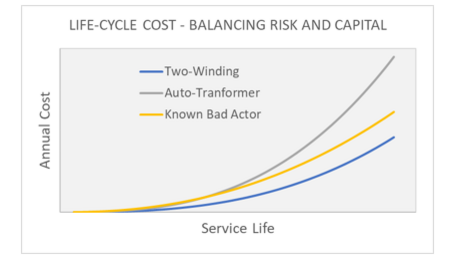
A typical failure probability curve showing the annual probability of failure as a function of age. This is the right-hand side of the bathtub curve, when aging and wear-out failures dominate.
Curves differentiate among asset classes and sub-types. Note in this example the “known bad actor” (gold, a problem manufacturer/vintage) fails more often than the base two-winding curve (blue), and that auto-transformers (gray) fail faster still.
While it would always be nice to have better data to work with, the reality is that it may not be available. Meanwhile, we need a plan for next year. We must do the best we can with what information we have and leave ourselves a reminder to improve those inputs over time. The twin concepts of continuous improvement and the 80/20 rule are applied regularly during development.
Failure probability data, including condition and other relevant factors, is an excellent opportunity for sharing data among utilities. Groups such as the Electric Asset Best Practices Consortium, headed by the UMS Group, CEATI, or EPRI should take note.
Health Indexing
The models include asset health indexing, which has become common among electric utilities. BIS Consulting uses a custom, multiplicative algorithm that corrects two well-known problems with the traditional additive algorithm. First, it is not sensitive to missing data. Second, there is no masking of the important poor results by a flood of good but irrelevant ones.
The formulation, the list and weightings of tests and inspections for a given asset class, is based on industry standards, modified by the experience of the utility’s subject-matter experts. This is done in workshop settings where relevant experts review, discuss, and modify the formulation. This is a critical step for the long-term success of asset management. It is how the tacit knowledge of the utility’s experts is captured, and it facilitates acceptance and understanding.
Health indexing is not an end in itself. It is used to calculate “effective age” and to adjust the estimate of failure probability. Effective age is like your doctor telling you have the heart of an eighty-year-old. If we have a breaker with a calendar age of 20 years, but based on condition it looks 60, we will treat it as 60 for the purposes of calculating failure probability. In most cases, health index is used to adjust effective age only upward from the calendar age, not downward. The reason is that we are more convinced by a single bad test than we are by any number of good ones.
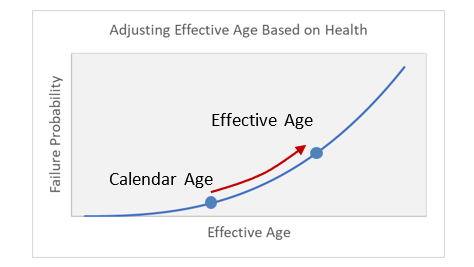
Health Index is useful because it helps us predict failure. In the CCRA model, we link health to failure probability using effective age.
Whatever the asset’s calendar age, if based on its health it looks older, we treat it as older for the purpose of predicting failure by adjusting its effective age.
Consequence of Failure
The final major input is consequence of failure, or criticality. The approach is familiar: a workshop setting where SMEs discuss, consider available data, and reach a decision. Consequences costs are calculated using failure scenarios. Failure scenarios are distinct from failure modes in that they define the range of consequences that may result from a failure rather than the things that go wrong to cause a failure. Each scenario includes an estimate of direct cost for repair of failed equipment, indirect cost due to associated damage, environmental and safety costs if any, and the cost due to outages.
For distribution assets, customer outage costs are calculated based on the type and size of the customers affected and the expected duration of the outage, using costs such as those from the Department of Energy’s ICE Calculator, available online. For transmission and generation assets, outage costs include replacement energy and other market costs, as well as possible system stability effects.
The expected consequence is the weighted average across all scenarios. For each asset class, we use our industry experience, and the utility experts to develop a list of scenarios that is representative. It is important that the definition of failure remains consistent when discussing failure probability and consequences.

Example Feeder Breaker Failure Scenarios
If a feeder breaker fails, one of several scenarios may follow. Each has its own set of direct costs, outage costs, and possible safety or environmental costs. Which scenario will occur can be known only probabilistically, and the relative probabilities may vary from one utility to the next due to differences in maintenance practices, breaker types, and system configuration (e.g., available fault current).
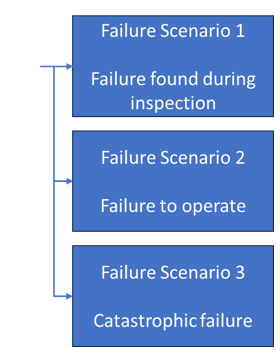
Scenario 1: the breaker may fail and sit there, uncalled, until the failure is found and fixed in the next inspection. This is relatively likely, and carries only a direct cost for corrective maintenance.
Scenario 2: the breaker fails and then is called to operate before the next inspection cycle. In this case the direct cost will be higher due to the emergency response, but more importantly the next-upstream device must operate, expanding the scope of the outage. This scenario carries a large outage cost component.
Scenario 3: the breaker fails catastrophically due to an internal fault or failure to operate. This includes even higher direct cost for cleanup and repair of adjacent equipment, a longer-duration outage, possible safety effects, and possible environmental consequences if the breaker contains PCB-contaminated oil.
Is it necessary to express outage and safety consequences in dollars? We believe it is unavoidable. We either will or will not undertake spending to mitigate a certain risk, and that decision implies an exchange rate between risk and dollars. We may tell ourselves that we haven’t put dollars to consequences, but we have. The question is only whether we are explicit and transparent about it. (Being explicit and transparent may be unadvisable for risk management reasons in certain regulatory environments.)
Implementation
Implementation of CCRA starts with workshops with SMEs to discuss failure scenarios and health index, followed by data gathering. Next the development team receives the data and creates a draft model whose results are reviewed with SMEs. After any needed adjustments, the final model, with accompanying documentation of inputs and assumptions, is reviewed and approved. In our work with utilities all of the models are developed using Excel with links to a database of your choice. Some clients are considering migrating out of Excel; however, there is a trade-off in transparency and the ability to make changes, so they generally proceed deliberately. The two most important parts of implementation are a) ensuring buy-in among technical SMEs and among non-technical audiences such as finance and regulatory groups, and b) knowledge transfer from the consultant to the utility’s asset management team.
Outcomes
Once CCRA models are implemented, they generally have an immediate effect on capital programs. We have found that the methodology resonates well with regulators and staff. They like the argument that, yes, we propose to spend additional capital, but we’ve considered the costs and benefits from our customers’ perspective, and we believe it will make them better off.
Example of Model Output
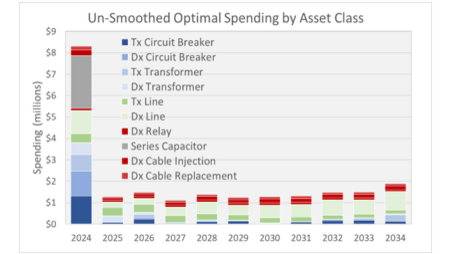
The long-range spending plan from several CCRA models. This is a typical result: the large spike in the first year is a backlog of replacements that should have been done already. Smoothing spending depends on prioritization both within cables and across other programs.
The economic model also produces B/C ratio and other metrics needed for prioritization.
Early success like this creates at toehold for asset management as the team works to integrate itself with the technical side of the business -- Planning, Engineering, and Operations – and with the less technical Finance and Regulatory side. Demonstrating value can generate momentum for other strategic initiatives that may require a larger commitment, such as a portfolio model, business case process, and data collection technologies.
Once CCRA models are implemented, they can become the basis for most day-to-day options analyses or benefit/cost assessments. It is common to see Asset Management groups not only expand the number of asset models but also create supporting processes for updating inputs and assumptions, grow a team of analysts to perform business cases, and coordinate with other sources of risk and benefit information. For example, some utilities have incorporated geo-risk (i.e., vegetation and animals) and wildfire risk into their lines models. Other have developed a cutting-edge integrated model that draws risk information from the CCRA models to evaluate complex projects with many assets and multiple drivers. The models can be used to support a very wide range of decisions, such as spares analysis, repair/replace, undergrounding of high-risk lines, and generator life-extension, and system configuration options.
In all, our experience suggests leveraging economic risk models is a good choice as the first step for executing asset management strategic plans. Creating the models exposes the team to many important topics, such as risk, condition, and cost/benefit. It helps to generate early wins, which gives their group credibility and solidifies their value in the decision-making processes.
Biography
Darin Johnson is the President of BIS Consulting, an asset management specialty firm. His expertise includes condition and risk analysis of aging infrastructure, independent business case support, and asset management strategy for electric transmission and distribution, water/wastewater, power generation, and natural gas utilities.
Banner and thumbnail credit: Brandon Morales on Unsplash
Suggested content