Managing Voltage issues caused by Rooftop PV and battery – case study from New Zealand
Electricity utilities are continuously evaluating new customer technologies for possible impacts if they become mainstream. A forthcoming future is for residences to be self sufficient in electricity generation by installing rooftop solar and battery storage, and making a side income by exporting their excess power to the grid. Where this occurs on a large scale what does it mean for the utility? Already, for new-build housing estates in New Zealand a developer is requiring that every dwelling has rooftop PV installed [1]. In this article the analysis of one such installation is given along with conclusions.
By Dan Martin, Essential Energy, Australia, and Russell Watson, Northpower, New Zealand
In NZ a rural customer connected a battery and rooftop solar system to the local grid, giving us the opportunity to study and make conclusions. While the power output of individual community installations is very small compared to traditional large generators on the entire network, there will be a growing cumulative effect which may change how we manage networks.
In this case, the installation elevated the line voltage over statutory limits resulting in curtailed export, and so possible solutions were sought. There is also the revenue and expenditure side of the utility to consider, as they make the most of their income from supplying electricity to customers. If customers purchase less energy then the distribution businesses will need to change ways to fund infrastructure development and operation.
This manuscript is split into the following sections. Firstly, an overview of the applicable standards for managing inverter voltage rises. Secondly, tapping the distribution transformer to obtain the desired voltage. Thirdly, our local experience how the power factor of LV networks has been changing which affects the voltage. Fourthly, the case study on the rural block with rooftop solar and battery. Lastly, the implications for the network and conclusions.
Applicable standards and managing voltage rises
As most networks were designed before rooftop PV became mainstream, the general strategy was to keep voltages as high as permitted, expecting voltage drops to the load. This strategy reduced the chance of customers experiencing low voltage, for instance sluggish motors on farms. However, it is well known that LV connected generation can raise the voltage above statutory limits. There is an Australian and New Zealand standard, AS/NZS4777.2 [2], which specifies two methods to reduce a voltage rise. One is that the inverter gradually reduces its active power output once the voltage exceeds 242 V. Two is the inverter begins to absorb reactive power once the voltage passes 235 V, although this option is disabled by default for a high proportion of inverters as it only became required in the 2020 standard update.
The voltage can be tapped down either using the distribution transformer, or at the zone substation power transformer. However, a network may then experience a too-low voltage when there is no, or insufficient, local generation. Household batteries add extra complexity to voltage management since now energy from solar PV might not be exported as expected during the day.
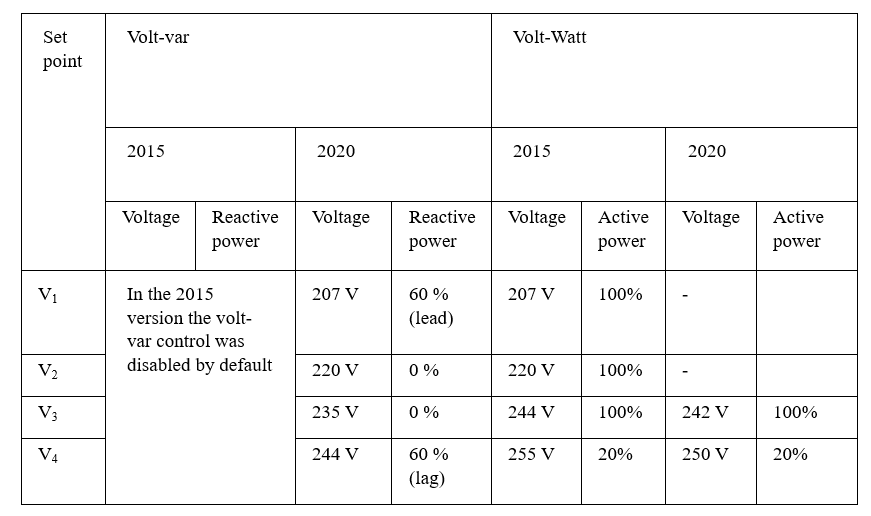
Table 1 - Voltage set points for volt-var and volt-Watt response according to AS/NZS4777.2 [2]
Tapping the distribution transformer voltage
The allowable network voltage is 243.8 to 216.2 V at the point of connection with the customer, and to achieve this the distribution transformers are tapped to the nearest to 240 V at no load. On rural blocks there may be a significant voltage gradient between this point of connection and the house caused by long LV wires. Whereas there is a 24 V fall permitted due to impedances between the transformer and customer, there is only a 4 V rise. The permitted voltage band is therefore asymmetrical.
The voltage control within a zone substation is also often asymmetrical, e.g. a power transformer can have twenty-two steps to maintain voltage, although only six are to buck and the others to boost. Some distribution transformers only have one buck tap which can reduce the voltage by about 6 V. This is a coarse control of voltage compared to its allowable range, and that the voltage may fall in the evening at peak load.
In Australia there is a move to transition from 240 to 230 V. However, this assumes that there is a sufficient capacity to tap down both in the distribution transformer and the upstream power transformer. Some networks cannot tap to 230 V because the ends of many LV spans would have a too-low voltage. In rural areas farms can operate motors which reduce the voltage. Clusters of houses can have a peak evening load, especially in the winter with electric heating, which also causes the voltage to fall at night. This can prevent the local transformer being tapped down, and then the solar PV causes the voltage to rise in the summer daytime.
Changing nature of networks
Local LV networks are being seen to have a leading power factor, for instance as shown in Figure 1, even when there is no rooftop solar. Both distribution and power transformers are highly inductive, and so a leading power factor will result in a voltage rise, compounding the effect of rooftop solar. This reactive power has been observed to be relatively steady across a day, unlike active power, and so has not caused more operations in the upstream transformer tap changer. At the transmission level, an excess reactive power can elevate voltages requiring shunt reactors [3], [4], [5], [6].
Considering the future, there may be a need to manage capacitive reactive power flows in a zone substation. An aim is to maintain the power factor close to unity at the point of connection with the transmission network. As networks are usually expected to be slightly inductive, capacitor banks are often installed in the zone substation to balance power factor. The control centre may be able to remotely switch these off to lower the line voltage if the power factor is too leading, and vice-versa.
If customer loads become more capacitive overall, then this is counterproductive to efforts to prevent significant voltage rises along the LV.
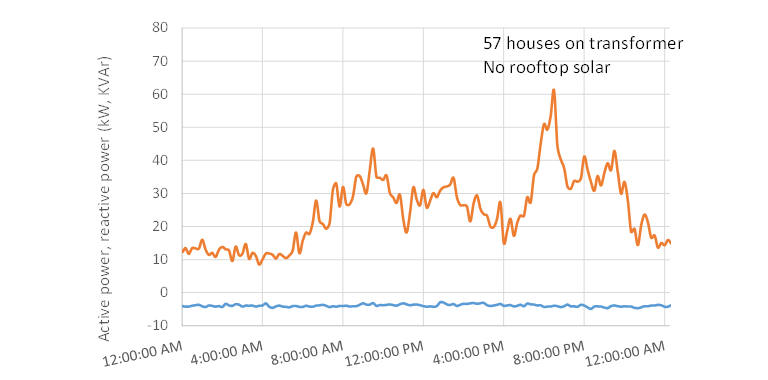
Figure 1 - Load profile of housing showing leading power factor
Rural block with rooftop solar and battery
One house was set up with self-sufficiency in mind, where the rooftop PV and batteries were rated so that the customer would not need to import power, Figure 2. The rooftop solar starts charging the batteries in the morning, and once the batteries are charged then the excess power is sold to the grid. Only excess solar is exported, i.e. not from the battery. The customer complained that the grid inverter was shutting down due to over-voltage, and so they were not realising the full benefit of the solar. A study was carried out on this installation, and consideration what could happen to a utility if many dwellings became like this.
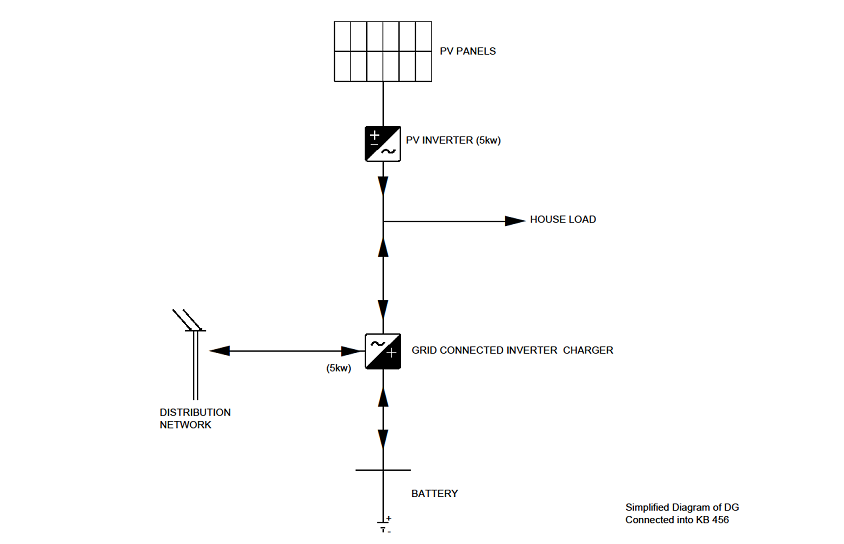
Figure 2 - Simplified diagram of DG system, showing the rooftop PV inverter supplying the house load, and a separate inverter connected to the grid
The site was 11 km along the 11 kV overhead line from the nearest zone substation, connected on one phase of a 15 kVA three phase transformer. Approximately 230 m of underground four core sectorial cable, 70 mm2 aluminium, was run to the metering station, and then another 100 m to the house, shown in Figure 3 and Figure 4. The impedance of long stretches of LV runs can lead to significant voltage swings. The utility is only responsible to keep the voltage at the point of connection with the customer property within statutory limits. If there is a further voltage rise to the dwelling then the customer has the responsibility to correct this. The site had been set to follow the 2015 version of AS/NZS4777.2 because the manufacturers were given a year to comply, and then time allowed for the inverters to be sold and installed. This means that the volt/var setting to manage voltage is disabled by default.
A preliminary evaluation of the site indicated that the tap of the distribution transformer was set too high, at +2.5%. The tap was then switched down once to its neutral position, and then loggers set up to check that the problem had been resolved. In this scenario there was only one customer connected to the transformer. If there were multiple houses and long LV lines, then this would add complexity to the solution. Most distribution transformers have one buck tap, while some have two, which provides some capacity to reduce the voltage.
After this analysis the distribution transformer was tapped down to -2.5%, its last setting, as this provided an optimum solution for the customer.
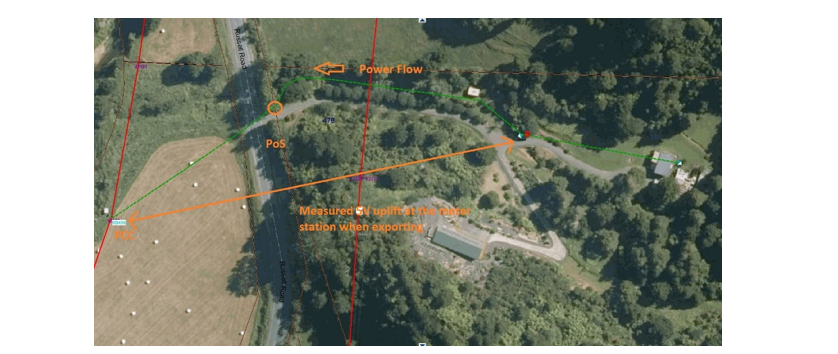
Figure 3 - LV supply to the distributed generation site
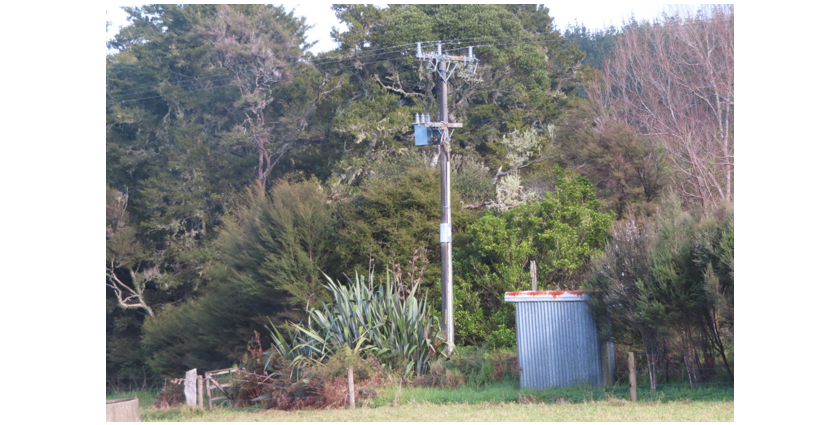
Figure 4 - Pole-top distribution substation
Monitoring was attached to both the distribution transformer and in the metering station, confirming the elevated voltage. The rise between the transformer and metering station regularly reached up to 5 V, Figure 5. Given that the house is 100 m further, the voltage rise is likely to be actually higher.
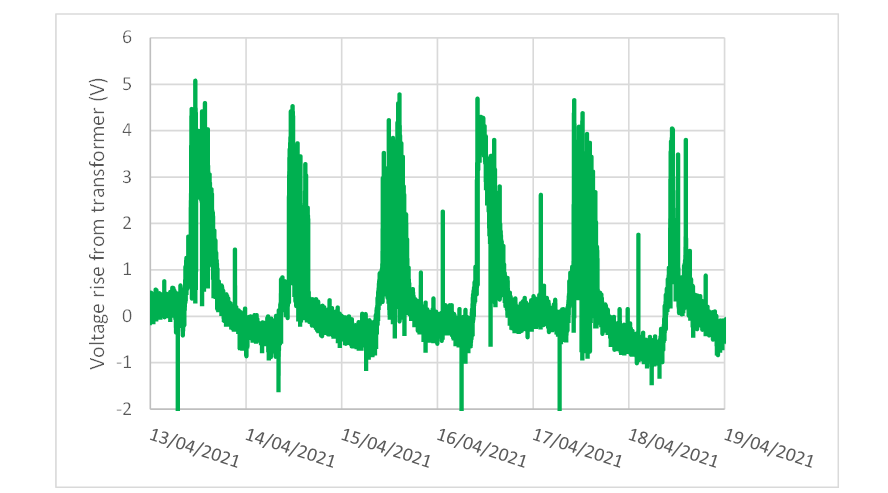
Figure 5 - Voltage rise between the distribution transformer, shown in Figure 4, and the customer’s metering point
An elevated voltage can be caused by upstream set points as well as by embedded generation. Therefore, the rises and falls in LV was correlated with the 11 kV MV and 33 kV subtransmission voltages. Data was collated and analysed for a 24-hour period. As can be seen in Figure 6 and Figure 7 the voltage is high at night, and the peaks and troughs in the LV waveform correlate with the upstream 11 and 33 kV network. The 33 kV line voltage is lowest in the early evening, correlating with when the consumers return from work. The 11 kV line voltage has another minima in the early morning, although the 33/11 kV power transformer has a tap changer which keeps this falling outside regulatory limits. The significance of this is that the higher nighttime voltages are not caused by this installation, but by the upstream network overall loading, line reactive characteristics, reactive compensation equipment, and transformer tap changer available range.
The substation power factor is slightly leading at night, Figure 8, which will contribute to the voltage rise. There is a 750 kVAr capacitor bank permanently connected, installed to reduce the reactive power offtake from the subtransmission network. The utility targets a unity power factor, and in future may need to remove capacitor banks or install reactors if the consumer load becomes more leading.
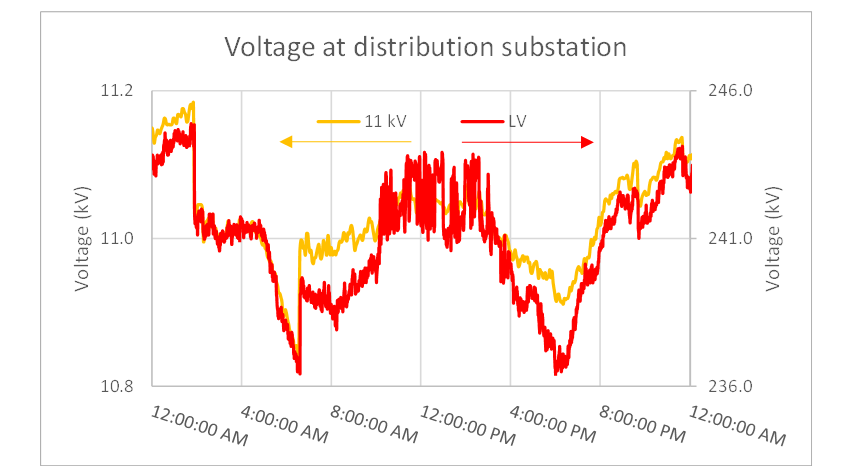
Figure 6 - Graph of LV and MV bus voltages at the distribution substation. The rises and falls in LV largely correlate with the upstream bus, indicating that the network is mainly responsible for voltage changes
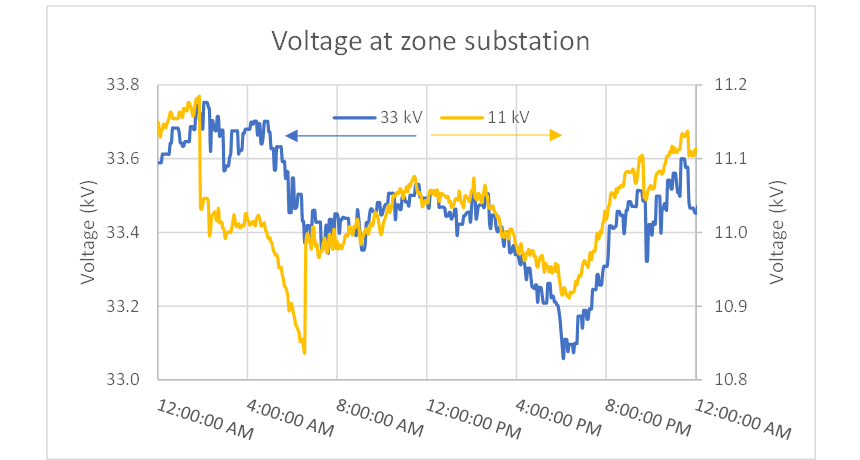
Figure 7 - Graph of zone substation 33 kV & 11 kV bus voltages. The waveform of the MV can be seen to be mainly following the HV, with some changes caused by the on-load tap changer of the power transformer
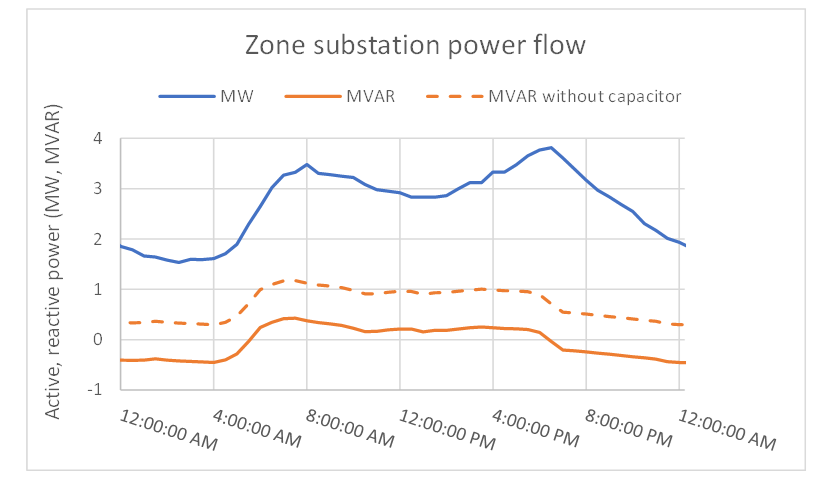
Figure 8 - Zone substation power flow
Analysis
Figure 9 shows the power exported from the site block and the respective voltages at the point of connection with the block and at the transformer. The parts of the graph can be explained by the following:
- Up to 11 am there is no export from the site. The voltage profile follows the shape of the 33 kV and 11 kV lines (Figure 7). The behaviour of the tap changer in the zone substation is apparent, stepping the voltage down and up. At around 6 am the voltage falls as people are waking up and the load increases. The rooftop solar starts charging the battery bank in the morning.
- After 11 am the site exports to the network, elevating the voltage. The export occasionally drops off as the battery bank is used and then the rooftop solar energy is diverted to replenish. The inverters begin ramping down power export at 244 V until 20% export at 255 V. The grid connected inverter is rated at 5 kW, and so a 3 kW output insinuates another 5 V rise between the metering station and the site because of the volt/watt curtailment. The volt/var response of the inverter was set to follow the 2015 standard, which is that it is not enabled.
- At around 4 pm the export falls again as the sun sets. The battery bank supplies the local load until the following morning again.
The voltage shown in Figure 9 is still slightly too high, as the allowable range is between 216 and 244 V. The transformer could be tapped down again by 2.5%, or about 6 V, as the minimum voltage is still within the correct range. In other sections of LV network the long cables and heavy loads could result in low voltages where the transformer cannot be tapped down. In these cases other solutions would need to be sought. Another option considered for this section of LV was to parallel two phases between the three phase transformer and metering section, reducing the impedance, as only one phase was used.
When a connection request is made by a customer the utility will check if the network can handle the change in voltage and load. If the customer is requesting more capacity than the network can provide, the utility will provide options to the customer that they would be required to contribute payment for.
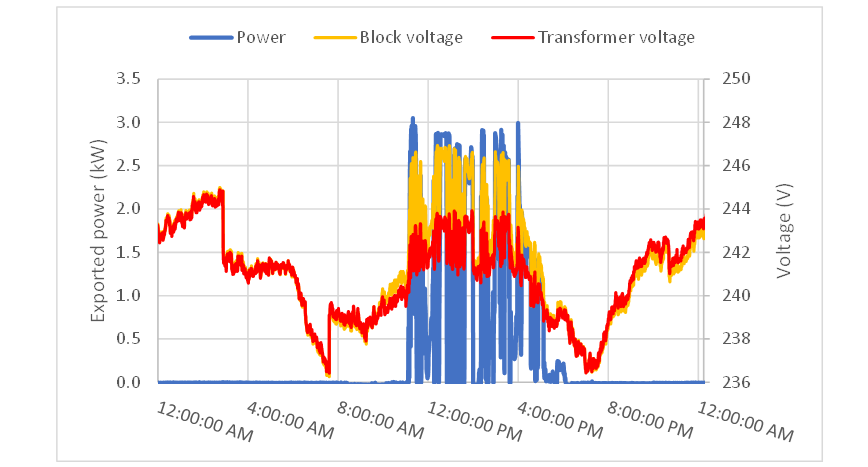
Figure 9 - Distributed Generation power flow & voltage at metering point
Network implications
At present, New Zealand utilities charge a daily network supply charge of NZ$0.1456 for low use, or NZ$1.3425 for standard and time of use, and a consumption charge of around NZ$0.25 per kWh. There is an export network charge of NZ$0.01/kWh introduced in 2022. A typical residence without solar may earn the utility NZ$1,000 annually. However, for one of these self-sufficient blocks the earnings are much lower, often less than NZ$100 per annum. Utilities will therefore need to consider other methods to recover costs from those customers forming a power injection community. Currently, the line charges for this site are being spread across all customers.
New installations must comply with the 2020 AS/NZS4777.2 standard for inverters, which mandates the use of volt/var response to lower voltage. Customers only receive income for their contracted active power supplied to the grid, rather than reactive power. If an elevating voltage activates the volt/watt or volt/var response, then the owner receives less income because they are not paid for reactive power. A positive side of volt/var response is that the power and distribution transformers forming the grid are highly inductive, and so some reactive power being absorbed from the LV system is very effective at reducing the voltage rise.
Conclusions
Changes to utility income models will likely happen as there is more uptake of batteries and solar.
While it is well known that rooftop solar elevates the line voltage, the industry was not so aware that the power factor of certain networks is becoming leading which also raises voltages. At the MV zone substation level the customer diversity is likely to still mean overall inductive loads. However, this might change as more equipment is retired and replaced with power electronic devices.
Changes to utility income models will likely happen with rapid uptake of batteries and solar. Presently, utilities are largely funded by selling energy to the consumer. An energy self-sufficient community will still require a utility to manage and operate the network.
References
- D. Martin, F. Geth, K. Lucas and R. Watson, "Implications of managing distribution network assets with a very high level of solar generation: New Zealand experience," in CIGRE International Symposium, Cairns, 2023.
- Australian/New Zealand standard 4777.2:2020, Grid connection of energy systems via inverters Part 2: Inverter requirements, 2020.
- C. G. Kaloudas, L. F. Ochoa, I. Fletcher, B. Marshall and S. Majitha, "Assessing the Future Trends of Reactive Power Demand of UK Distribution Networks," IEEE Transactions on Power Systems, pp. 99 - 110, 2017.
- M. Tazky, M. Regula and A. Otcenasova, "Impact of Changes in a Distribution Network Nature on the Capacitive Reactive Power Flow into the Transmission Network in Slovakia," Energies, vol. 14, no. 17, 2021.
- Powerlink Queensland, "Project Assessment Draft Report, Managing voltages in South East Queensland," Brisbane, 2022.
- Powerlink Queensland, "Project Specification Consultation Report, Managing voltages in South East Queensland," Brisbane, 2021.
Banner & thumbnail credit: Gary Webber on iStock
Suggested content