Road map for implementing ‘ONE SUN ONE WORLD ONE GRID’: an intercontinental power grid from Europe to South-East Asia
ONE SUN ONE WORLD ONE GRID (OSOWOG) has a geographical perimeter composed of 117 countries from Europe, Africa, and South-East Asia, across seven time-zones and representing one-third of the global power demand. According to the IEA-WEO-2020 Sustainable Development scenario, the electricity load will progress from 8,200 TWh in 2022 to 16,300 GWh by 2050.
By Nicolas CHAMOLLET
Convenor of C1.50 - Global sustainable energy system coupling electricity and hydrogen
Introduction
The central scope of work of Phase 2 is the identification of major interconnections to valorize untapped RES potential such as hydro, solar, and wind power. This assessment is based on an economic adequacy forecast study of the perimeter from 2022 to 2050, including:
- Assessment of existing/planned grid strengthening,
- Review of possible transmission technology,
- Preliminary line routing,
- Modelling and economic optimization, and
- Assessment of the cost of generation facilities, opportunity costs (capacity avoidance costs, environmental costs related to the program/initiative), and landed cost on the Indian periphery.
The first concrete objective is to identify two or three cross-border power interconnection projects that can be initiated within one or two years, considering India as the fulcrum of an intercontinental interconnected power system embryo.
Regional power system initiatives are playing a key role, expanding on the study perimeter, from numerous bilateral initiatives to regionally planned initiatives mainly in the framework of economic communities promoting mutual interests
In this context, 15 zones have been defined, based on a proper geographical scalable modelling. In South-Asia region, one zone represents each country. Other regions are represented by one zone each. The following map illustrates this grouping:
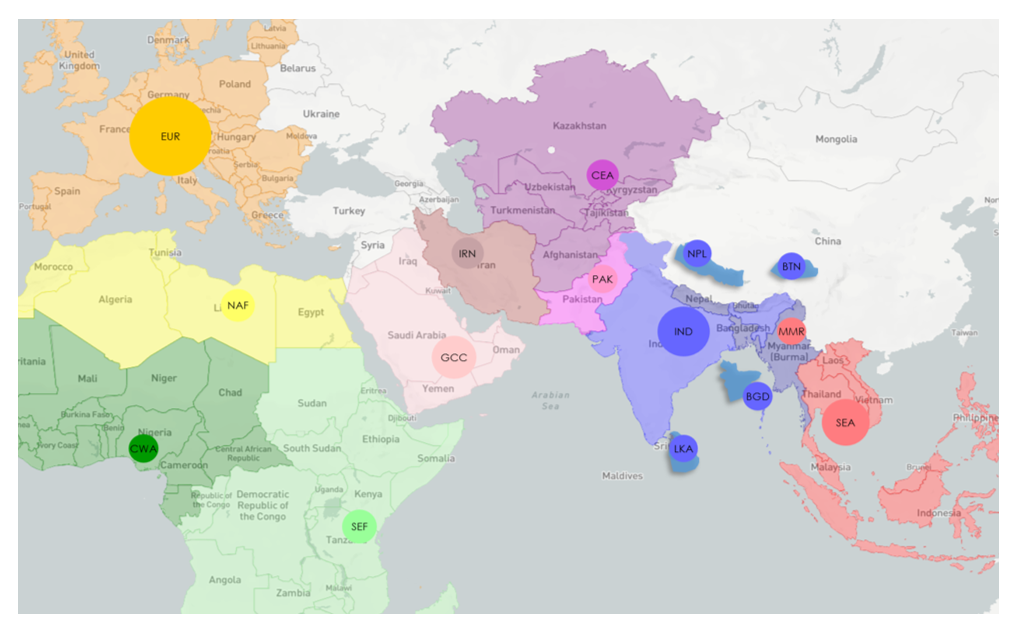
Figure 1 - Regional organizations are fostering connectivity, shaping the landscape of electricity connectivity for RES integration
Regional initiatives are fostering connectivity, shaping the landscape of electricity connectivity for RES integration, spreading influence, overlapping, and revealing junction countries which could become the energy hubs of a future Euro-Asia intercontinental power market.
For each of the 15 zones, hourly load pattern has been defined from 2022 to 2050 representing 254,208 hourly values. For multi-countries zone, load pattern of each country has been considered in the aggregated zonal load pattern.
Shaping a future intercontinental power system originating in India and spreading throughout Europe, Africa, and South-East Asia
There are 19 potential power corridors representing a cluster of multiple cross-border power lines between the 15 zones:
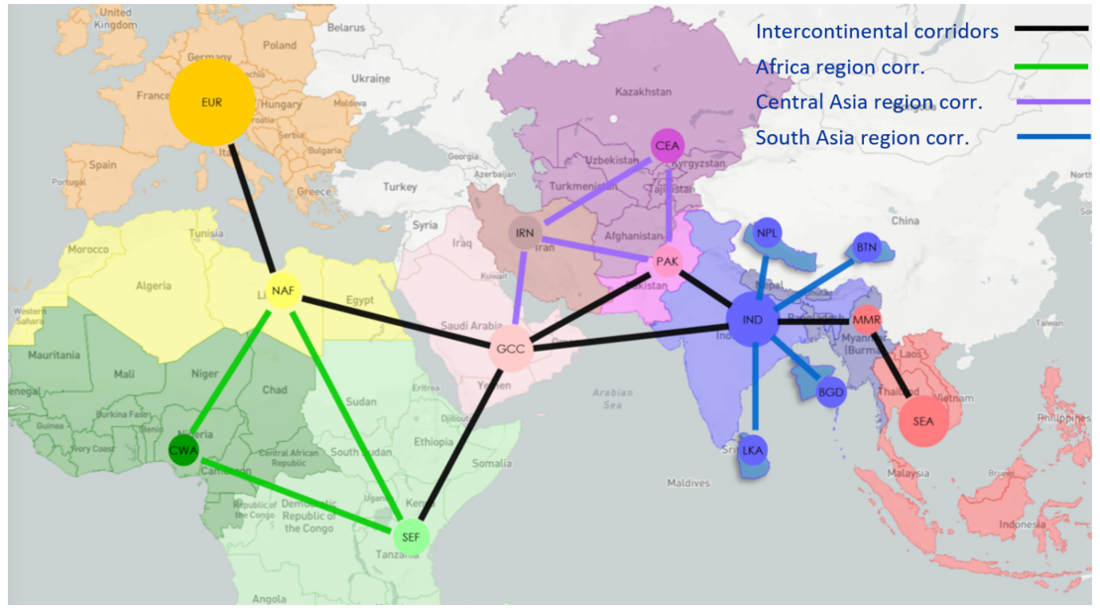
Figure 2 - 19 potential corridors (cluster of power cross-border lines) to link the 15 zones
Each Corridor modelling is based on:
- Terminals selected among capitals, major cities, large power plants, existing substations (400 kV+) in meshed networks,
- Length: realistic line routing along existing corridors (roads, railways, etc.),
- Techno: OHL-HVDC or USC-HVDC + Inverters,
- Initial capacity = sum of the capacities of all cross-border lines in operation,
- Economic parameters for future development (in competition with power generation and storage,
- Economic life at 30 years.
- Losses: %/km + %/inverter
- Unit installed capacity cost ($/GW) for futures development: low cost and high cost (4 x low cost) defined a range cost to consider grid sensibility in the overall power system cost,
- Internal reinforcement coefficient:
- from 0 to 10 GW: Initial cost
- from 10 to 20 GW: Initial cost x 10
- from 20 to 30 GW: Initial cost x 40
This increase in costs accompanying the installed capacity is justified by the need for significant strengthening of regional transmission networks and the acquisition of the remaining less suitable land.
Currently only one intercontinental corridor is operational between Europe and North Africa with a capacity of 1.4 GW, and regional corridors are developed essentially around India.
Toward a future intercontinental power system based on reducing (or not) carbon emissions and/or (or not) power exchanges
Five scenarios built according two political dimensions: grid expansion and CO2 reduction
- Slow progress (Scenario 1): Business as usual with limited cooperation and no SPC pricing ambitions (except Europe).
- Market cooperation (Scenario 2): Win-win regional collaboration (power exchanges) without SPC (except Europe) ambitions.
- Own green transition (Scenario 3): Ambitious individual SPC without regional collaboration (interconnections are restricted).
- Green power pool (Scenario 4): Common SPC agreement, and common regional power pool including common regional transmission plan to foster massive and efficient RES deployment.
- IEA net zero (Scenario 5): A fifth scenario, which could be defined as a “super” scenario 4, has been added to explore consequences of SPC proposed in IEA net zero emission scenario.
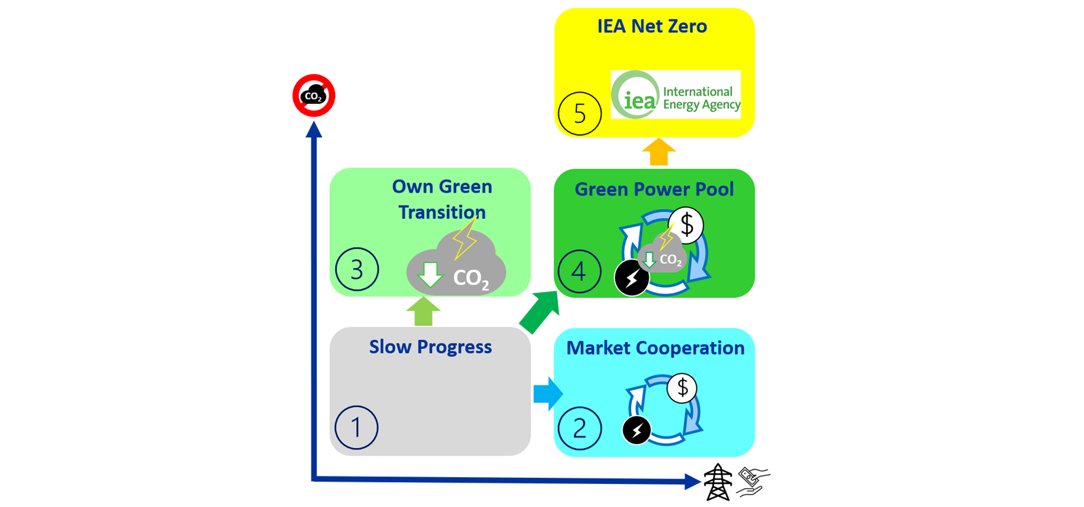
Figure 3 - Scenario building
OSOWOG 2022-2050 Roadmap: An eco-sustainable intercontinental power system to be develop between Europe, Africa, Middle East, and Asia, with India as the fulcrum of a global power pool embryo
By 2030, there is an eco-sustainable interest to develop an intercontinental power backbone from Europe to South-East Asia
From 2022 to 2030: There is a need to start the development of an intercontinental power backbone from Europe to South-East Asia:
- OSOWOG roadmap could start with an intercontinental power backbone from India to South-East-Asia, and from India to Middle East via Pakistan.
- From Middle East to North-Africa, there is already an interconnection between Saudi-Arabia and Egypt under construction, and interconnections crossing the Mediterranean Sea are already planned in the Med-TSO Ten-Year Network Development Plan.
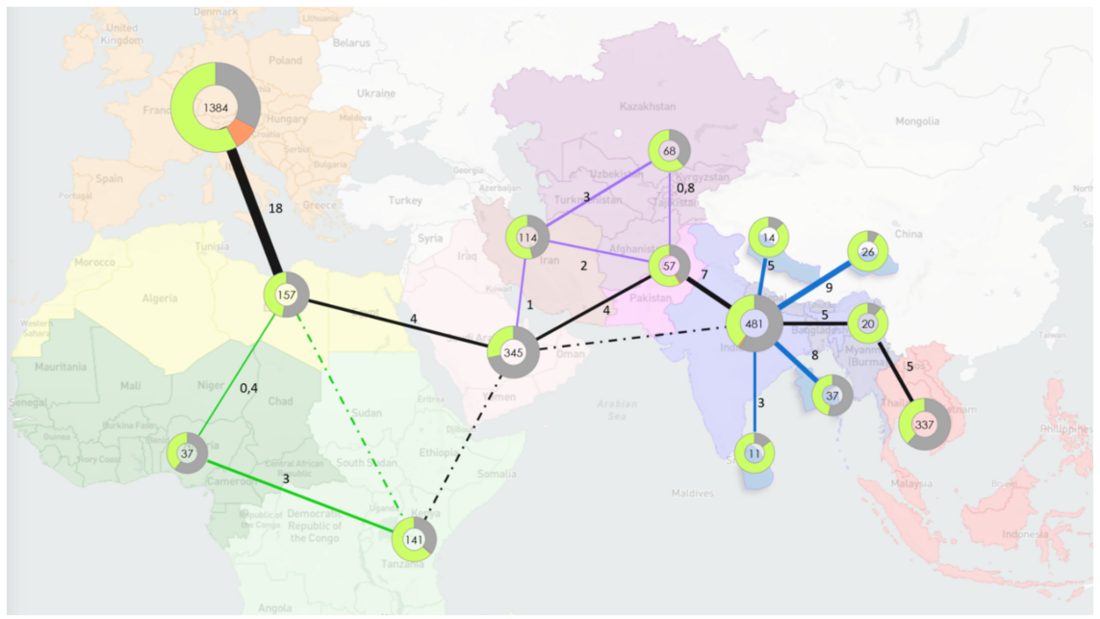
Figure 4 - Installed capacities by 2030 (GW, weighted results)
By 2040, technology maturity and India’s power needs could lead to the develop a valuable direct 2 GW under-sea cable between India and GCC
Western direct corridor India to Middle East could be deployed by 2040 with a first capacity of 2 GW for an investment of about two billion dollars.
Each corridor from North-Africa to South-East Asia could increase by about 1 GW. Overall, 11 GW of cumulated corridors could be committed for an investment of $5,6 billion.
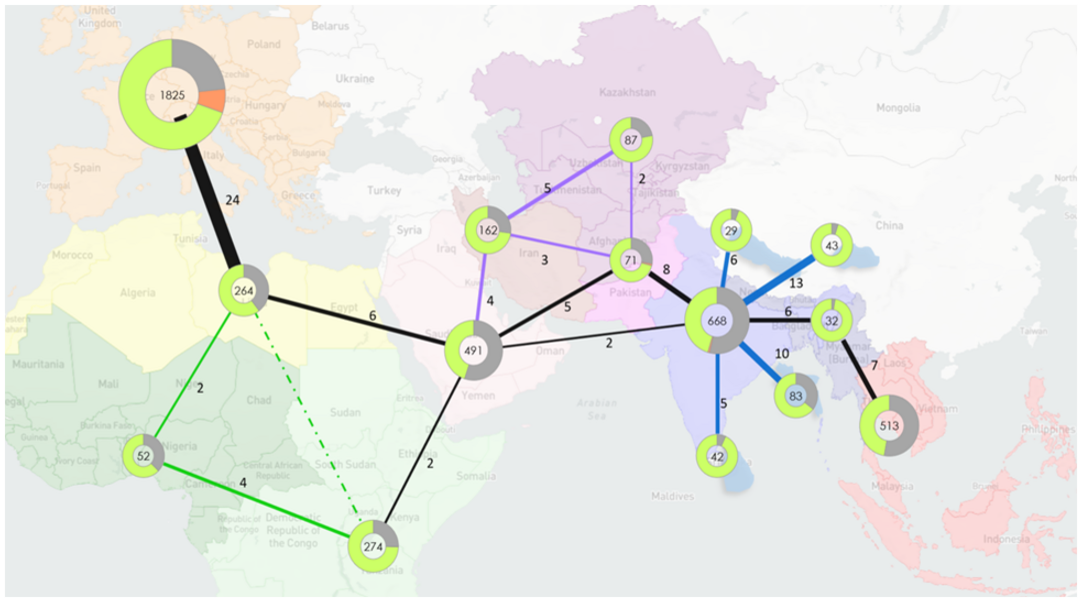
Figure 5 - Installed capacities by 2040 (GW, weighted results)
By 2050, sum of intercontinental power corridors could hit 49 GW for $25 billion investment, from which 24 GW around GCC
Overall, the sum of intercontinental corridors (black color on the following map) development hit 49 GW for $25 billion of investment.
From India, Western and Eastern corridors hit 13 and 8 GW representing respectively 26% and 16% of cumulated intercontinental corridors capacity.
24 GW of cumulated power corridors developed around Middle East: corridors from GCC represent 78% of the investment thereby confirming the importance of the GCC as power hub to develop OSOWOG initiative.
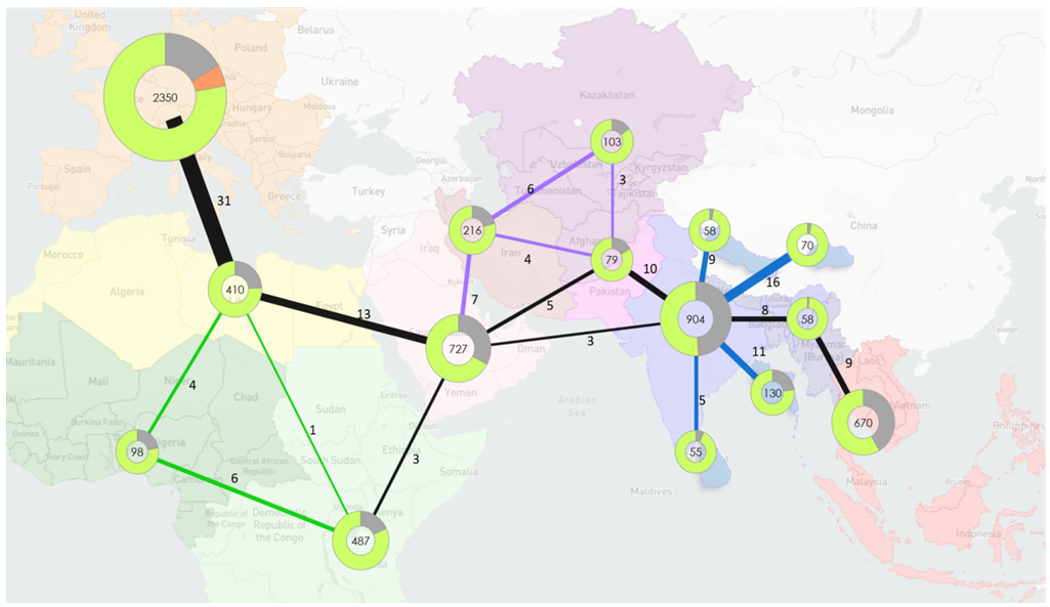
Figure 6 - Installed capacities by 2050 (GW, weighted results)
By 2050, the generation mix capacity increase from 2,300 GW to 6,400 GW (3-fold), including RES from 750 to 4,600 GW (6-fold)
From 2022 to 2050, total production capacity could produce a three-fold increase from 2,300 GW to 6,400 GW and production investments 6-folds increase from $56 to $320 billion/yr.
Distribution of production investment switch from Europe to other zones, and switch from fossil-fuel to renewable by 2050.
From 2022 to 2050, RES capacity should increase from 750 GW to 4,600 GW (x6). PV capacity development is about triple of wind.
Storage capacity could eight-fold increases from 3,100 (2022) to 25,000 GWh (2050).
By 2050, carbon emission restrictions could lead to massive RES development, decreasing unit electricity costs ($/MWh) by 50% without collaboration and to 60% with an intercontinental power grid, increasing the benefice by 20%
Outside North-Africa - Europe, major intercontinental power flows are concentrated on the backbone GCC – Pakistan – India – Myanmar and driven by RES pooling. Around India, hydro generation is the main driver to develop cross-border power flow.
India is the most important power importing zone with import volume progressing from 365 TWh/yr in 2030 to 795 TWh/yr corresponding to 20% of yearly demand by 2050. India’s power imports are mainly coming from Nepal, Bhutan, and Myanmar hydro power.
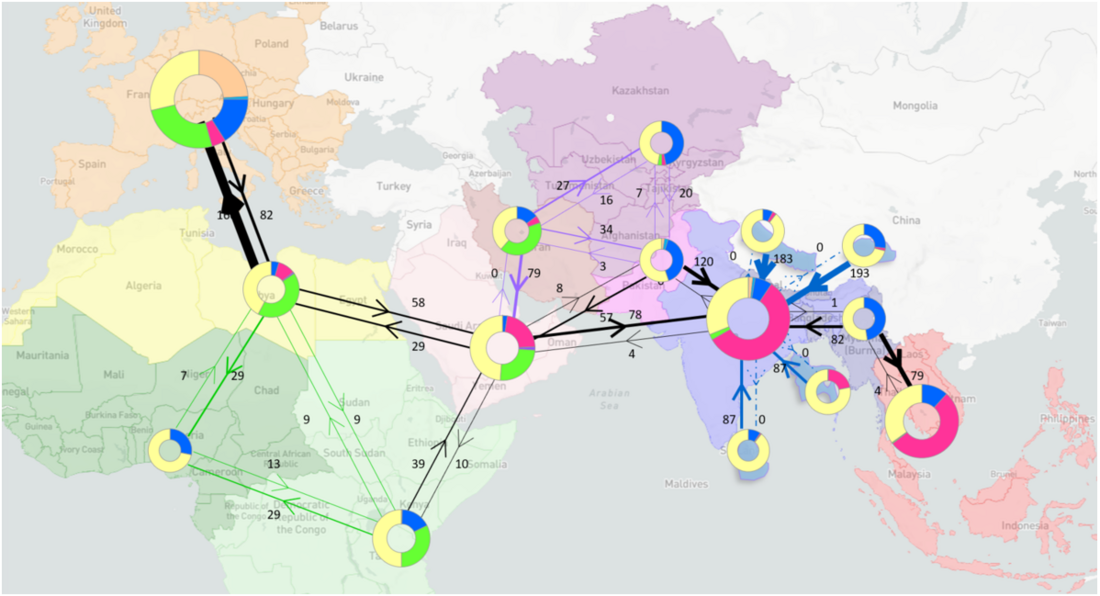
Figure 7 - Yearly power exchanges (Green Power Pool 2050, TWh)
The overall unit electricity cost ($/MWh) decreases by 50% thanks to RES with negligible variable cost, and by 60% by adding intercontinental power corridor development
The overall unit electricity cost ($/MWh) decrease by 50% from 19 to 10 $/MWh thanks to the development of RES production technologies with negligible variable cost, and development of power corridors.
Thanks to massive RES and power corridors development, unit electricity cost decreases faster in scenario 4 (green power pool) than other scenarios, by 60%, from 20 to 9 $/MWh.
By 2050, unit electricity cost in scenario 4 (green power pool) is 20% lower than scenario 1 (slow progress) and 10% lower than scenario 3 (own green transition).
International agreement on the shadow price of carbon progress could drive carbon emission decreases by 80%. Adequate SPC rent ($billion/yr) distribution among countries engaged in a common sustainable vision could permit the financial investment in sustainable switch of power generation
With international SPC implementation, carbon emission intensity could be reduced by 80% by 2050 in scenario 4 (green power pool) and by 78% in scenario 3 (own green transition).
Without SPC, CO2 emissions intensity increase by 10% in scenario 1 (low progress) and scenario 2 (market cooperation) by 2050.
Common SPC rent ($billion/yr) could widely support huge RES investments:
- Total investment until 2050 is estimated between $7,2 billion (scenario 4) and *8 billion (scenario 3).
- Average SPC rent decrease progress from 21,000 in 2022 to $8 billion/yr in 2050.
Adequate SPC rent ($billion/yr) distribution among countries engaged in a common sustainable vision could permit the financial investment in the sustainable switch of power generation.
Main Takeaways
The study perimeter incorporates an heterogenous electricity power landscape from Europe, via Africa, the Middle East to Asia including 117 countries representing 33% of the load, growing to reach 40% in 2050.
Compound annual growth rate is about 2,4%.
South Asia GDP growing to become the main load center.
From North-Africa to South-East Asia, there is an eco-sustainable profit to develop an intercontinental power backbone
By 2030, cumulated installed capacities could reach 25 GW for a budget of about $7.5 billion.
By 2050, cumulated installed capacities could hit 49 GW from which 24 GW would be developed around the GCC region.
From India:
- Eastern power corridor toward South-East Asia to be developed with 5 GW by 2030, up to 8 GW by 2050.
- Western power corridor toward GCC could be developed via Pakistan in a first stage with 7 GW by 2030.
- Direct India-GCC power corridor could be developed in a second stage with 2 GW by 2040.
From GCC:
- Western power corridor to North-Africa could increase from 3 GW currently under construction up to 13 GW linking MedGrid power pool to Pan-Arab power pool.
- Interconnection with South-East Africa could be deployed 2 GW by 2040 and up to 3 GW by 2050.
International agreement on SPC decreases carbon emission by 80%
Carbon emissions intensity increases by 10% in scenario 1 (slow progress) and in Scenario 2 (market cooperation) by 2050.
Carbon emissions intensity decreases by 78% in scenario 3 (own green transition) and by 80% in scenario 4 (green power pool).
Power interconnections decrease green generation switch extra costs by 20%
The extra cost to develop green power production mix to meet the CO2 emission target by 2050 without international collaboration is about 60%. Scenario 3 (own green transition) is 60% more expensive than scenario 1 (slow progress).
Development of power corridors to pool RES in a common intercontinental power market decrease green power production mix extra costs by 20%. Scenario 4 (green power pool) is 20% cheaper than scenario 3 (own green transition).
How far is the ‘Green Deal’? By pooling RES with an intercontinental power backbone would be easier to build than a common agreement to set SPC progress, leading to the necessary financing for RES investment
- OSOWOG aims to share renewable energy sources in a common power pool but also the investment effort and the income.
- Implementation of a SPC agreement could provide the income necessary to support the huge switch to a green power production mix in developing countries.
- Promoting energy connectivity and regional cooperation could be a strong driver to foster a global transition to clean developing power systems.
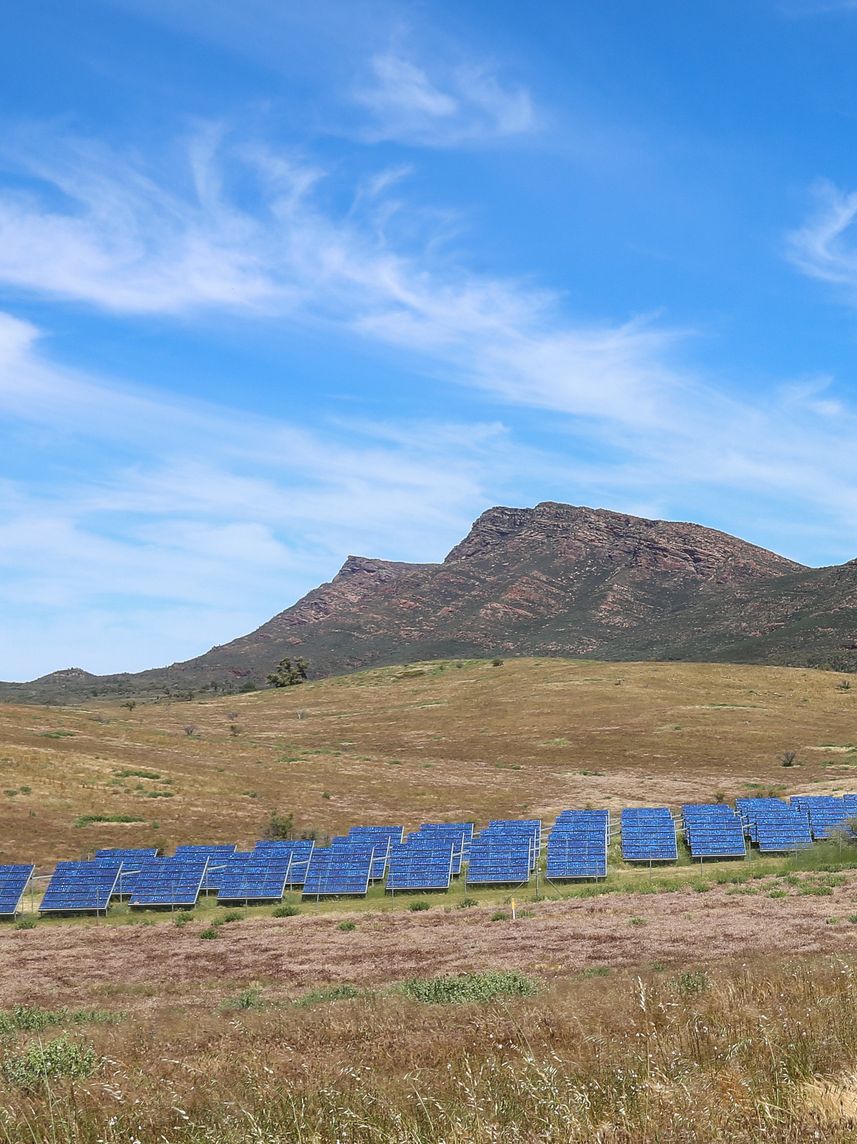
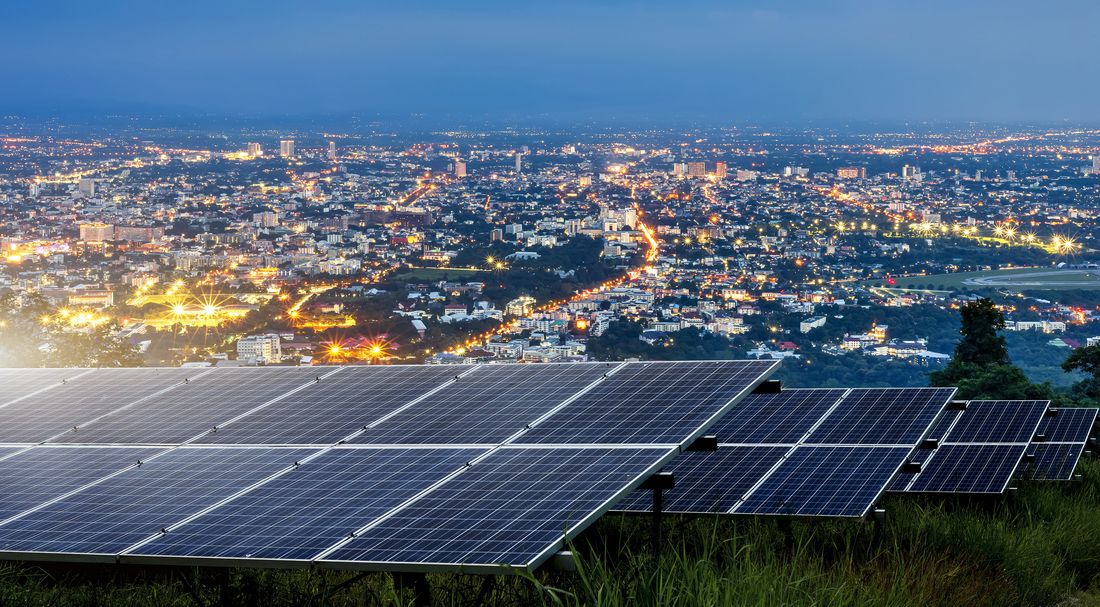
Banner & thumbnail credit: Thinnapob on iStock
Suggested content