Load sound power levels for specification purposes of three-phase 50 Hz and 60 Hz liquid-filled power transformers
In the industry there is an increasing awareness observed that load sound, depending on transformer parameters and loading, contributes to, and may even dominate the total sound level of a transformer in service. This results in a growing tendency to specify the permissible sound level not only for no-load operation, but also for the loaded transformer when purchasing new transformers.
Members
Convenor
(DE)
C. PLOETNER
Secretary
(PT)
E. ALMEIDA
A. AL-ABADI (DE), H. BRUNE (DE), F. CORNELIUS (DE), J. DICKINSON (GB), J. DONCUK (CZ), G. FEI (CN), M. GILLET (FR), W. GOETTE (DE), S. KANO (JP), J. KIM (KR), K.H. LEE (KR), G. NADOR (HU), Y. ODARENKO (AU), M. PIRNAT (SI), B. SIMONS (NL), P. TARMAN (SI), F. TRAUTMANN (DE), M. WARREN (CA), K. YAMAGUCHI (JP), J.C. YANG (KR), J. YOO (KR), H. YU (CN), S. YUREKTEN (TR)
Progress report prepared by Bart Simons (NL)
Specifying a realistic load sound level for power transformers is often challenging due to limited availability of reliable and validated information. This easily leads to physically unrealistic load sound level specifications, either unnecessary high, e.g. NEMA TR 1 standard [1], or, as has been a trend in recent years, unachievable low without using external sound mitigation measures.
To provide guidance towards more realistic load sound level specifications, an improved model, based on the physics behind load noise and on the Reiplinger load sound equation [2] is developed for three-phase 50 Hz and 60 Hz transformers.
The results are presented in the form of easy to use curves, giving the typical load sound levels. The load sound model is defined in such a way that with the information available during the transformer procurement process, it is possible to estimate the load sound level.
The parameters of the developed load sound model are based on statistical analysis on an in the industry unique large database, containing 1359 carefully selected datasets, collected by 14 independent transformer manufacturers World-wide.
The presented work about load sound is part of the scope of CIGRE WG A2.54 task to study “Power Transformer audible sound requirements”. The intention of Study Committee A2 in establishing this working group was to provide support information and guidance for the industry for sound level specification of new power transformer purchases [3]. This article, written on behalf of CIGRE WG A2.54 is meant to be complementary to the CIGRE paper “No-load sound power levels for specification purposes derived from more than 1000 measurements – a representative figure for three-phase transformers” [4] as well as to the first interim report of WG A2.54 published in ELECTRA 302, February 2019 [5].
Causes of load sound
Load sound of a transformer is the sound caused by the physical effects of load currents flowing in transformer windings, as illustrated in Figure 1. The contributing elements to load sound are:
- Windings (usually dominant),
- Stray flux control elements,
- Structural parts.
At the right side in Figure 1, the current, leakage field and resulting forces are indicated. At the left and bottom side, elements’ vibrations and paths for the vibrations towards the tank are illustrated. At the transformer air side, vibrations of the tank are passed to the surrounding air, emitting an audible sound.
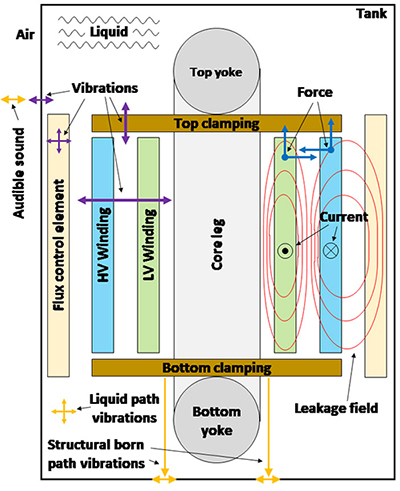
Figure 1 - Cross-section of a transformer illustrating the generation process of load sound
The vibrations emitted from the windings are usually the dominant contributor to the load sound. Since the magnetic field is proportional to the load current, the resulting force is proportional to the load current squared, at twice the excitation frequency. The magnitude of the vibrations depends also on the elastic properties of the conductor, the electrical insulation and the proximity of mechanical resonance frequencies of the complete winding assembly (e.g. windings, insulation, insulating liquid, clamping construction, clamping pressure). The elastic moduli of the conductors but also of the insulation material are approximately constant in a well designed and produced winding at normal operating currents. Higher harmonics in the vibration of the windings are therefore minimal and the fundamental mechanical frequency (twice the excitation frequency) is dominant for the vibration and therewith the load sound. Higher harmonics in the load sound spectrum as shown in Figure 2 are mainly caused by vibrations from stray flux control elements and structural parts [6].
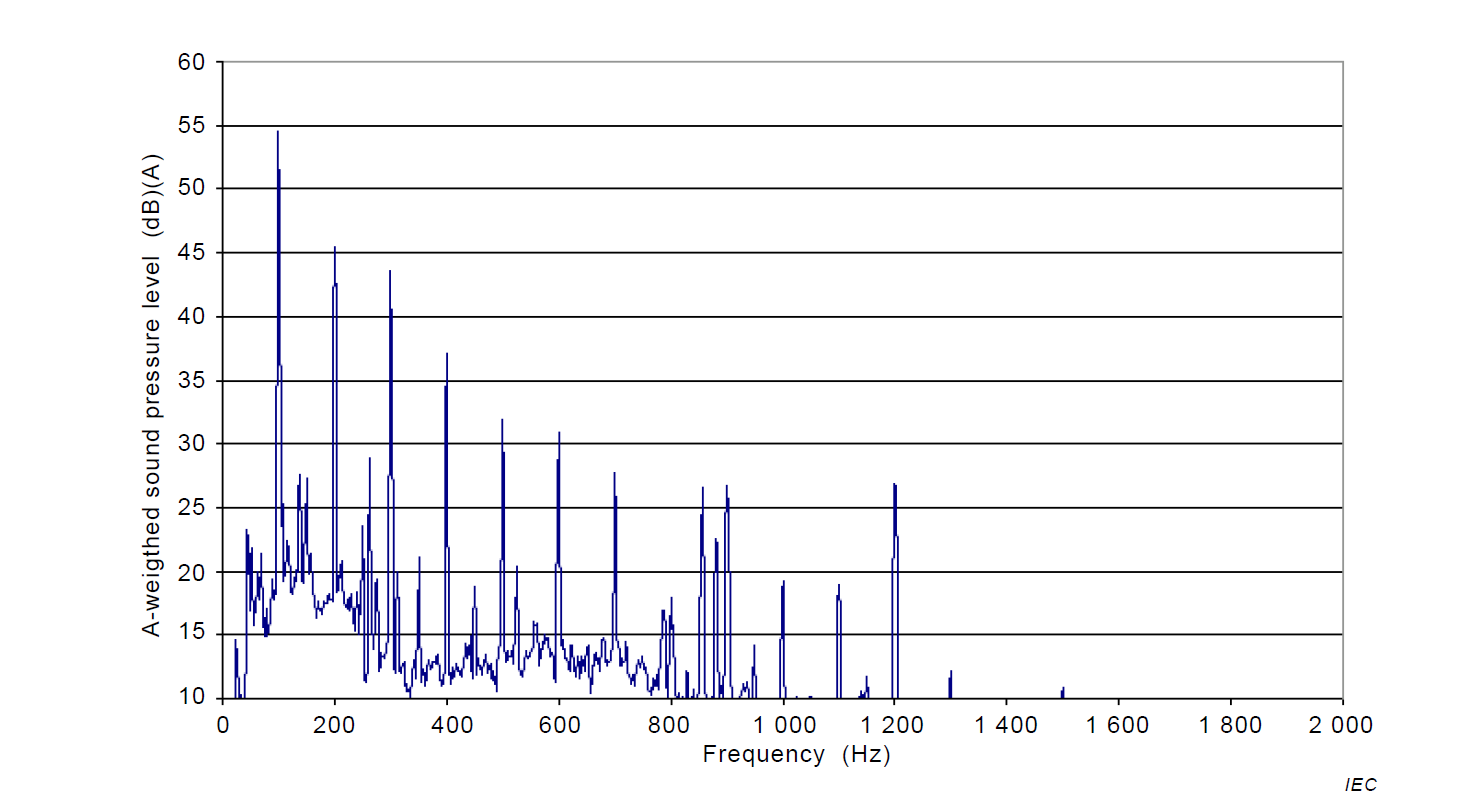
Figure 2 - Example of a typical Load sound spectrum (Source IEC 60076-10-1:2016 [6])
Relation between load sound and transformer rated quantities
As described before, the dominant contribution to the load sound of a transformer is the vibrations of the windings. The vibrations of the windings are caused by Lorentz forces acting on the windings.
In mechanical terms, the combination of load current and leakage field results in the Lorentz forces. In electrical terms however, the combination load current and leakage field is the reactive power Q of a transformer. Reactive power Q and Lorentz force F are proportional and can be related to each other via the magnetic energy Wm, stored in the leakage field of the transformer.
![]()
The magnetic energy is defined as:
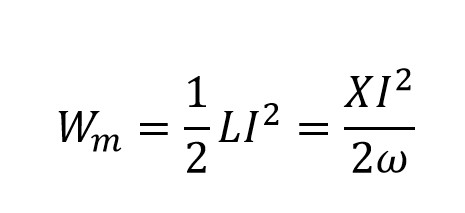
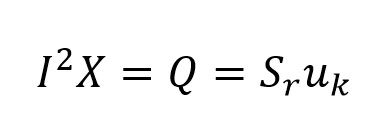
The product XI2 is the reactive power Q required to establish the leakage field of the transformer. The reactive power can also be expressed in terms of (rated) apparent power Sr and pu impedance voltage ![]() k:
k:
Combining these relations, a direct relation between reactive power and total force acting on the transformer windings is found:
![]()
As the proportional relation of force and vibration is also applicable to the load sound level Ll, a direct relation between load sound level and reactive power of the transformer is established:
![]()
Collected datasets
The developed load sound model is based on statistical analysis on a large database, containing 1359 datasets, collected by 14 independent transformer manufacturers World-wide. Each individual dataset was carefully quality checked to ensure a reliable database.
Following boundary conditions are set to the collected datasets:
- Transformer power range from 4 MVA to 1500 MVA,
- Power frequency 50 Hz and 60 Hz,
- Three-phase and single-phase transformers,
- Liquid-filled transformers, no distinction is made between different liquids,
- Transformer cooling: ONAN/ODAN/OFAN/ODWF/OFWF (i.e. no running fans during sound test),
- Core-form and shell-form transformers,
- “Standard” transformers, including typical sub-station and generator transformers. Transformers for special applications including HVDC transformers, phase-shifting transformers, testing transformers, mobile transformers, and furnace/rectifier transformers are excluded,
- No external sound mitigation measures applied (panels or enclosures),
- Sound power levels in database are based on the sound intensity measurement method,
- In case the sound pressure measurement was used, the sound level was corrected to a sound intensity level by following simplified correction:
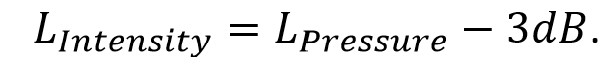
- In case the sound pressure measurement was used, the sound level was corrected to a sound intensity level by following simplified correction:
- A-weighting is applied to all measurements,
- Sound measurements are performed according the rules given in IEC 60076-10:2001 [7] or 2016 [8] or according IEEE C57.12.90-2010 [9] or 2015 [10],
- Measurements using the walk-around procedure and the point-to-point procedure both apply.
The validated datasets are split into three-phase and single-phase, and in 50 Hz and 60 Hz transformers. The number of datasets per group are shown in Table 1.
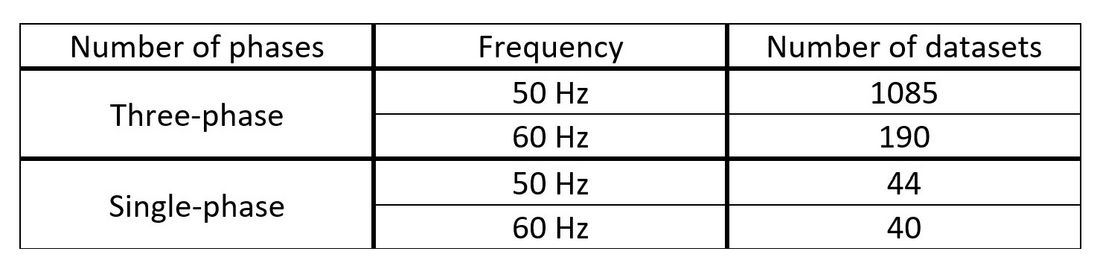
Table 1
The model presented in this article is valid for three-phase 50 Hz and 60 Hz transformers. Single-phase transformers are not analyzed because a reliable statistical analysis is not possible due to the small number of datasets and the many different types of single-phase transformers.
Figure 3 presents all three-phase datasets. It is obvious that 50 Hz and 60 Hz transformers behave differently, therefore for the further analysis a distinction is made between them. More information on the differences can be found in [11].
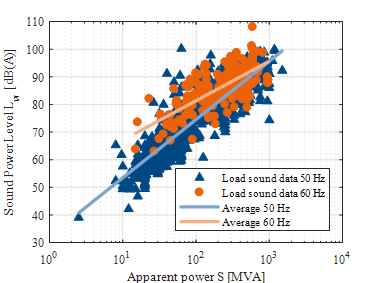
Figure 3 - Collected dataset for three-phase 50 Hz and 60 Hz transformers
Model description
Reiplinger load sound equation
The Reiplinger load sound equation [2] estimates the load sound power level of three-phase 50 Hz transformers and is based on the rated apparent power Sr in MVA (S0=1MVA):
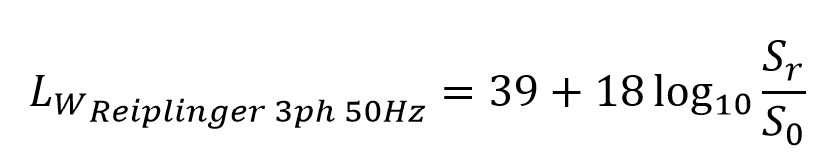
The equation was first presented in 1988 [2] and is still used today, simply because there is, up to now, no better, i.e. more accurate and easy to use alternative available to the industry. Considering the physics of load sound as outlined in the paragraph “Relation between load sound and electrical transformer parameter”, it is clear that the apparent power is a major determining parameter. Therefore, the Reiplinger load sound model is predicting the load sound level of a transformer rather accurate, specifically for transformers with “normal, average” impedance voltage. Because the Reiplinger load sound equation is still frequently used today, and to prove that the newly developed model is an improvement versus the Reiplinger load sound equation, at first a statistical evaluation of the Reiplinger load sound equation is made using the relevant datasets of the collected database: The statistical evaluation results in a standard deviation of 5,3 dB(A) and a mean value of -0,6 dB(A). It is found the Reiplinger equation overestimates the load sound power level for the power range < 100 MVA and underestimates it for transformers > 100 MVA, see Figure 4.
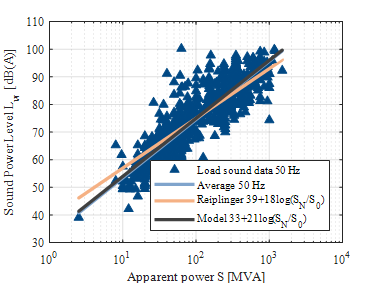
Figure 4 - Three-phase 50 Hz transformers comparison with the Reiplinger load sound model
By applying a linear regression to the relevant datasets of the collected database, a new set of model parameters for the Reiplinger model is found:
![]()
With this set of parameters, the standard deviation is found to be 5,1 dB(A) and the mean value - 0,4 dB(A), see Figure 5.
For three-phase 60 Hz transformers, the same analysis has been performed with following results:
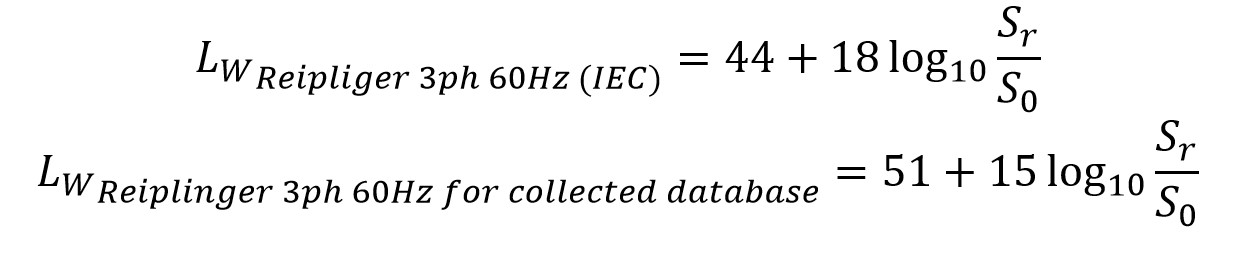
The standard deviation was found to be of 5,5 dB(A) with a mean value of -0,3 dB(A) for the original model parameter used in [6] and drops to a standard deviation of 5,3 dB(A) with a mean value of 0,2 dB(A) for the newly derived model parameters.
Improved load sound model
As shown in the previous paragraph, the Reiplinger load sound equation results in a rather good prediction of the load sound power level. Considering the physics behind load sound, it is clear that the apparent power is a major parameter though it does not fully represent it. The Reiplinger load sound equation can therefore be improved by using the reactive instead of the apparent power.
The new load sound model is defined to enable the load sound power level estimation based only on the functional properties of the transformer, which are known at an early stage in the procurement process and which are the same for possible suppliers. Furthermore, the model is kept as simple as possible to make it easy to use. The load sound power level Lw of the transformer is defined as:
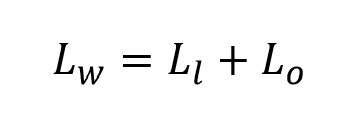
Ll is standing for the load sound power level estimated with the model using the apparent power and impedance voltage as input parameters. The model is described as
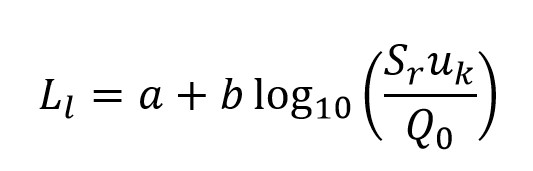
with a and b being constants determined from the statistical analysis of the collected datasets. The apparent power Sr expressed in MVA, the impedance voltage uk expressed in pu at a power of Sr and Q0=1 MVAr. The relation between Ll and Sruk is logarithmic because the sound level Ll is expressed in decibels. The influence of frequency (50 Hz or 60 Hz) is included in the constants a and b and results in two different curves for three-phase transformers at 50 Hz and 60 Hz, presented in next chapter.
Lo comprises all other factors impacting the load sound level of a transformer. Such are related to design and manufacturing, to measurement uncertainty and tolerances. Lo is the difference between the actual transformer sound power level LW and the estimated sound power level Ll.
Model parameter estimation
To determine the parameters for the load sound model, the following constraints are set:
- Three-phase transformers considered only,
- 50 Hz and 60 Hz transformers handled separately,
- No distinction made between different types of “standard” transformer,
- Impact of tap position to sound level is ignored,
- Impact of core design is ignored.
Three-phase 50 Hz transformers
For 50 Hz transformers in total 1085 datasets were received and analysed. The parameters a and b for the load sound model are determined by linear regression using the least square error method. After determining the model parameters, a statistically analysis has been performed to determine the accuracy of the model.
For 50 Hz three-phase transformers the following model is found:
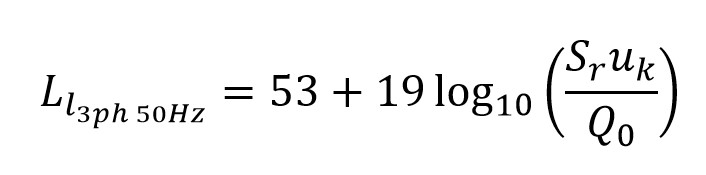
The statistical analysis shows that the model results in a standard deviation of 4,7 dB(A) and a mean value of 0,5 dB(A), see Figure 5.
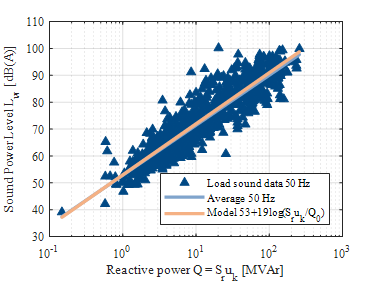
Figure 5 - Three-phase 50 Hz transformers
A standard deviation of 4,7 dB(A) means that the measured load sound power level of approximately 95 % of the transformers is within ±10 dB(A) of the estimated load sound power level using the new model. The spread of 20 dB(A) between the noisiest and most quiet transformer at the same reactive power rating can be fully accounted to Lo, i.e. the sound level contribution by all factors other than contained in the model, see above. This large spread indicates the challenge of predicting the load sound power level of a transformer during the design stage, because for the load sound level no distinct control parameter exists (such as the core induction for no-load sound level control) and the spread consequently being induced by many different factors. To improve the accuracy of the model, the factors and their impact have to be understood and the relevant parameters be added to the model. As such parameters are mainly design parameters and are only known by the manufacturers, they are exceeding the scope of WG A2.54 and will not be discussed here.
Three curves are presented in Figure 6 giving the typical range of load sound power level for 50 Hz three-phase transformers. The curve in the middle is the typical average curve described with equation
![]()
This curve indicates that 50 % of the transformer population produces a higher and 50 % a lower sound level than given by the curve. In other words, specifying a transformer at the average curve results in a reasonable chance that specific sound control and mitigation measures are required, resulting in a more expensive design.
The top curve is the typical natural upper limit curve, which is the average curve plus 10 dB(A). All transformers produced should be able to comply with this upper limit without making use of sound mitigation measures, resulting in a for sound purposes, low cost design.
The bottom curve is the typical natural lower limit curve, which is the average curve minus 10 dB(A). Almost all transformers are noisier than this lower limit. Specifying at this limit will likely lead to an increase in costs and in most cases require external sound mitigation measures to be applied.
In cases where the load sound power level has to be specified below the average curve, possible solutions should be discussed at first with the transformer manufacturers but potentially also with the suppliers of sound mitigation solutions to come up with a realistic technical and economical solution. To guarantee sound power levels below the average curve in Figure 6 without foreseen external sound mitigation measures is for manufacturers only limited possible.
Therefore, WG A2.54 recommends specifying normally only above the average curve in Figure 6.
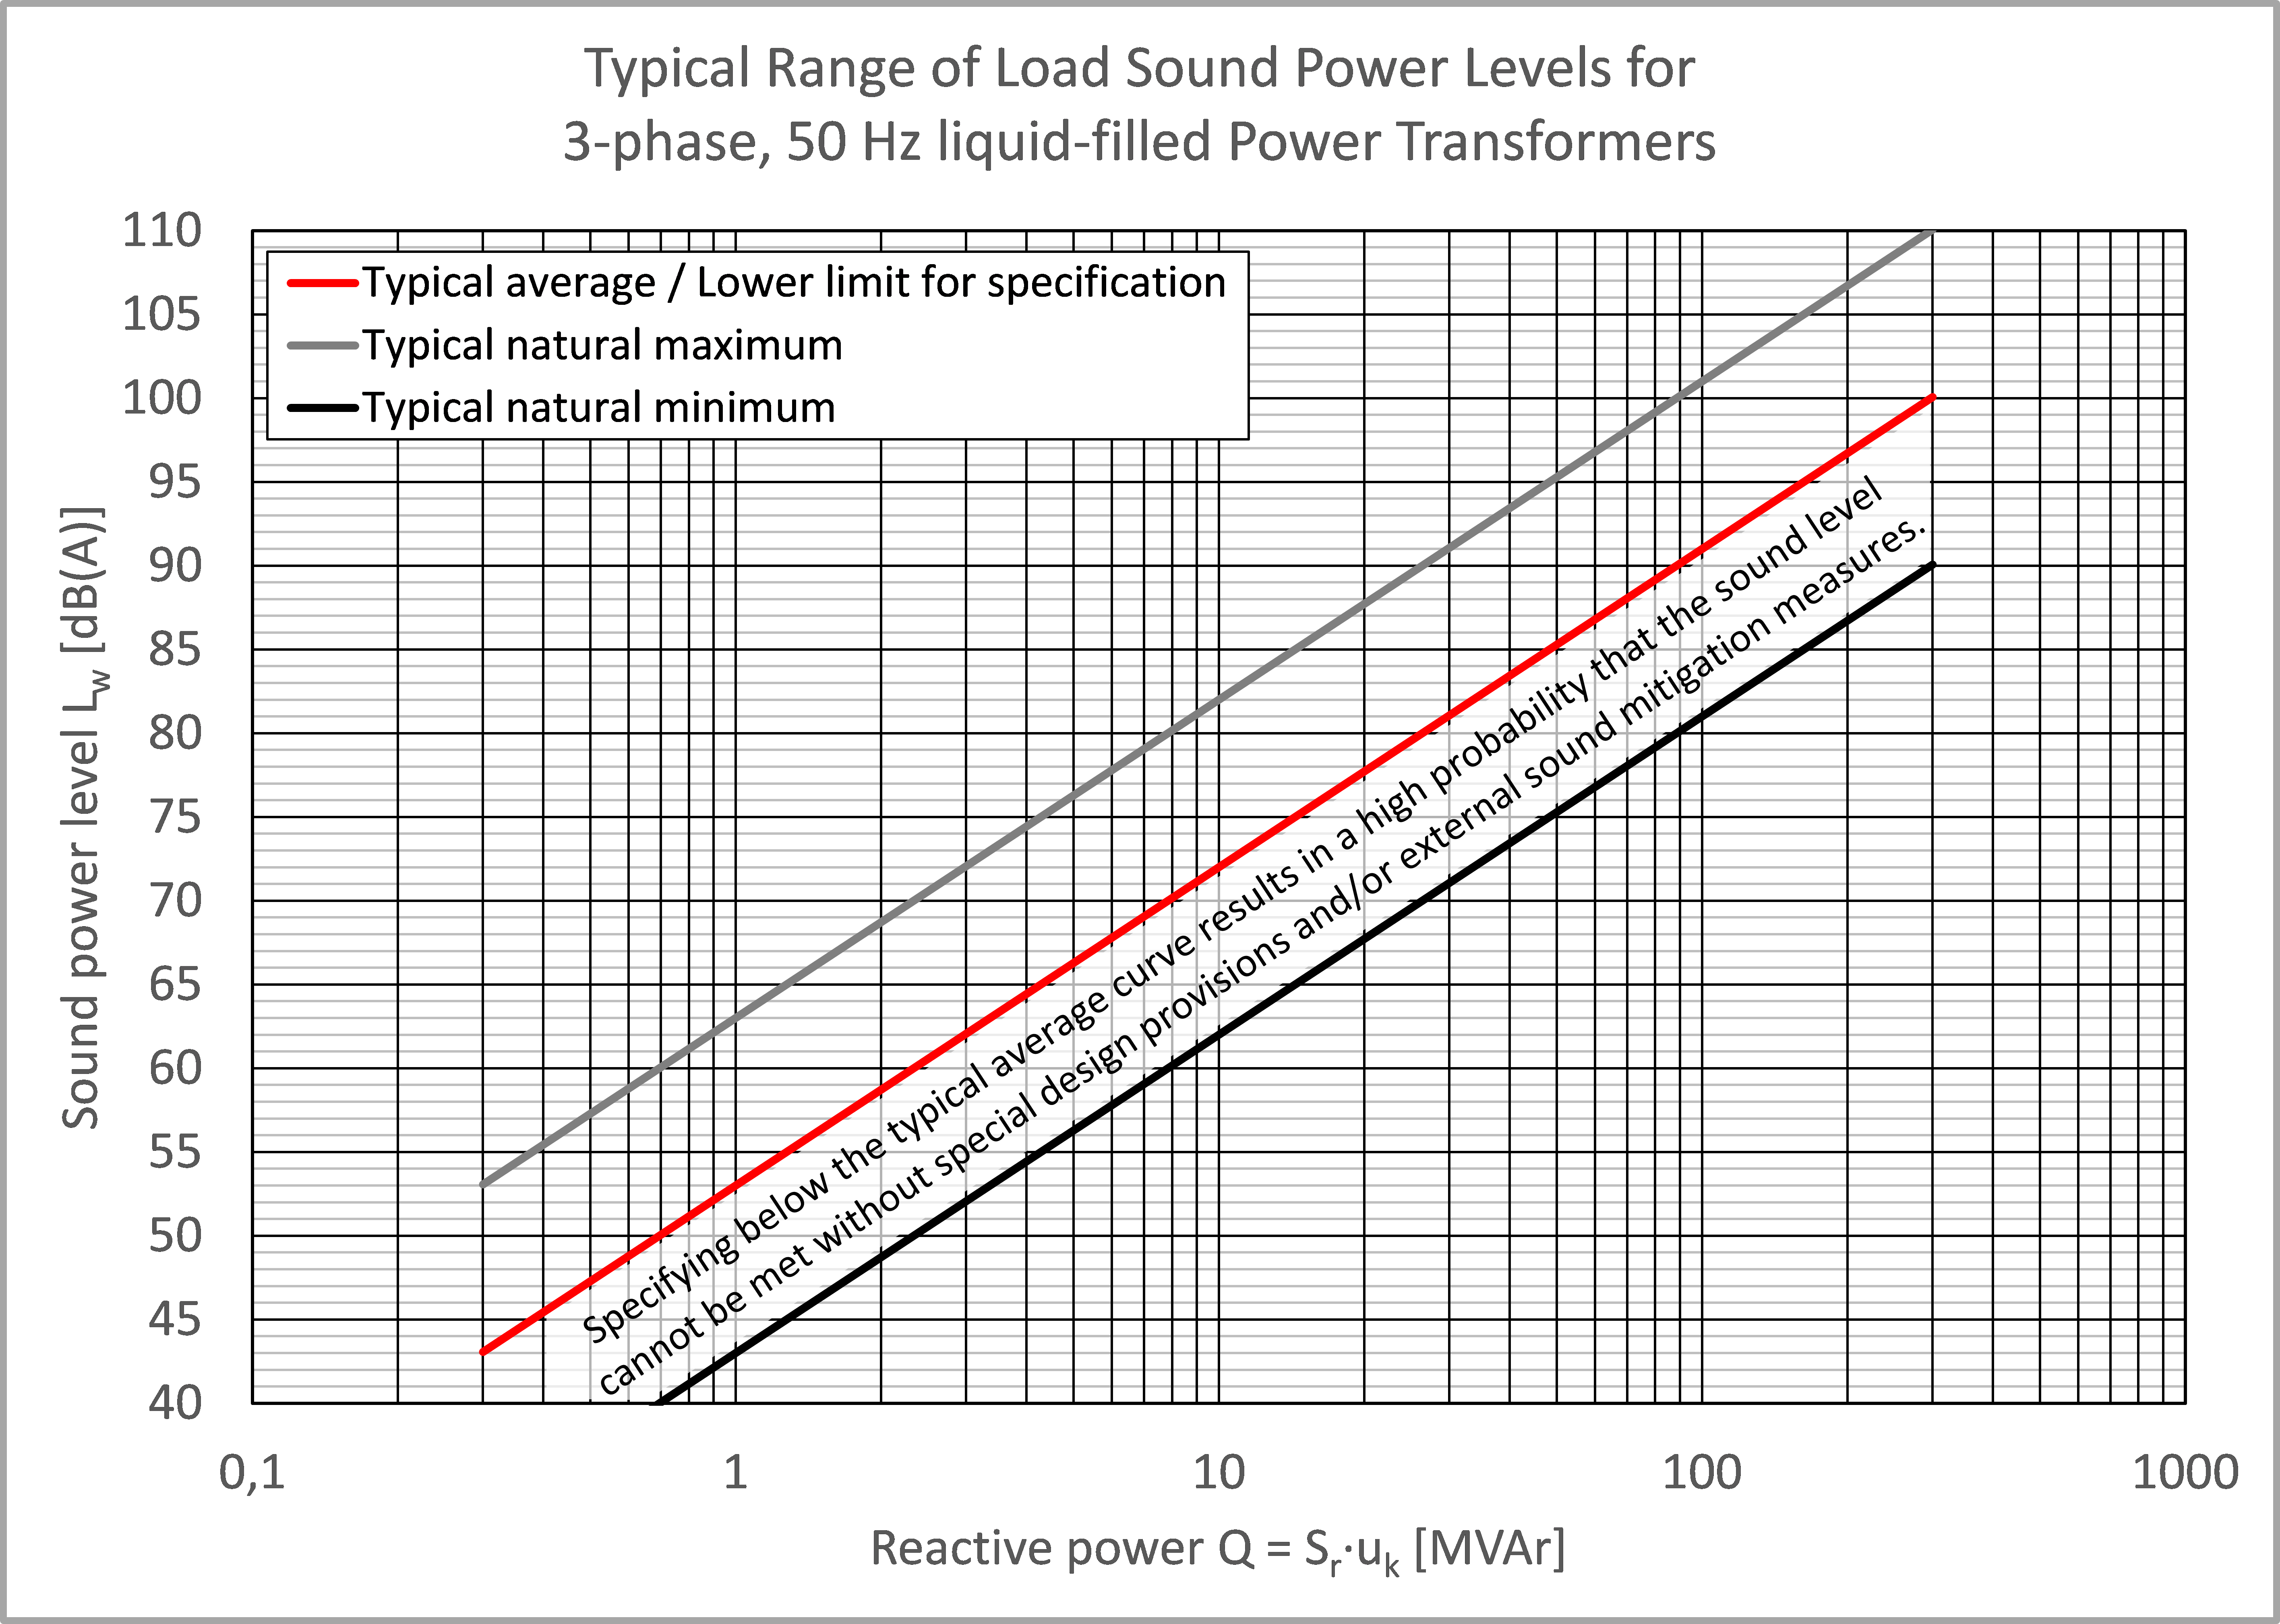
Figure 6 - Load sound power level curves for specification: Three-phase 50 Hz transformers
Three-phase 60 Hz transformers
For three-phase 60 Hz transformers the same analysis has been performed as for the 50 Hz transformer class. The following model is found:
![]()
The used model and model parameters result in a standard deviation of 4,8 dB(A) and a mean value of 0,1 dB(A), shown in Figure 7.
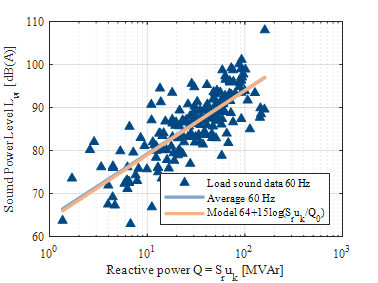
Figure 7 - Three-phase 60 Hz transformers
In Figure 8, the typical range of load sound power levels for 60 Hz three-phase transformers is given. Remarks given to the curves shown in Figure 7 for 50 Hz transformers apply likewise for 60 Hz transformers.
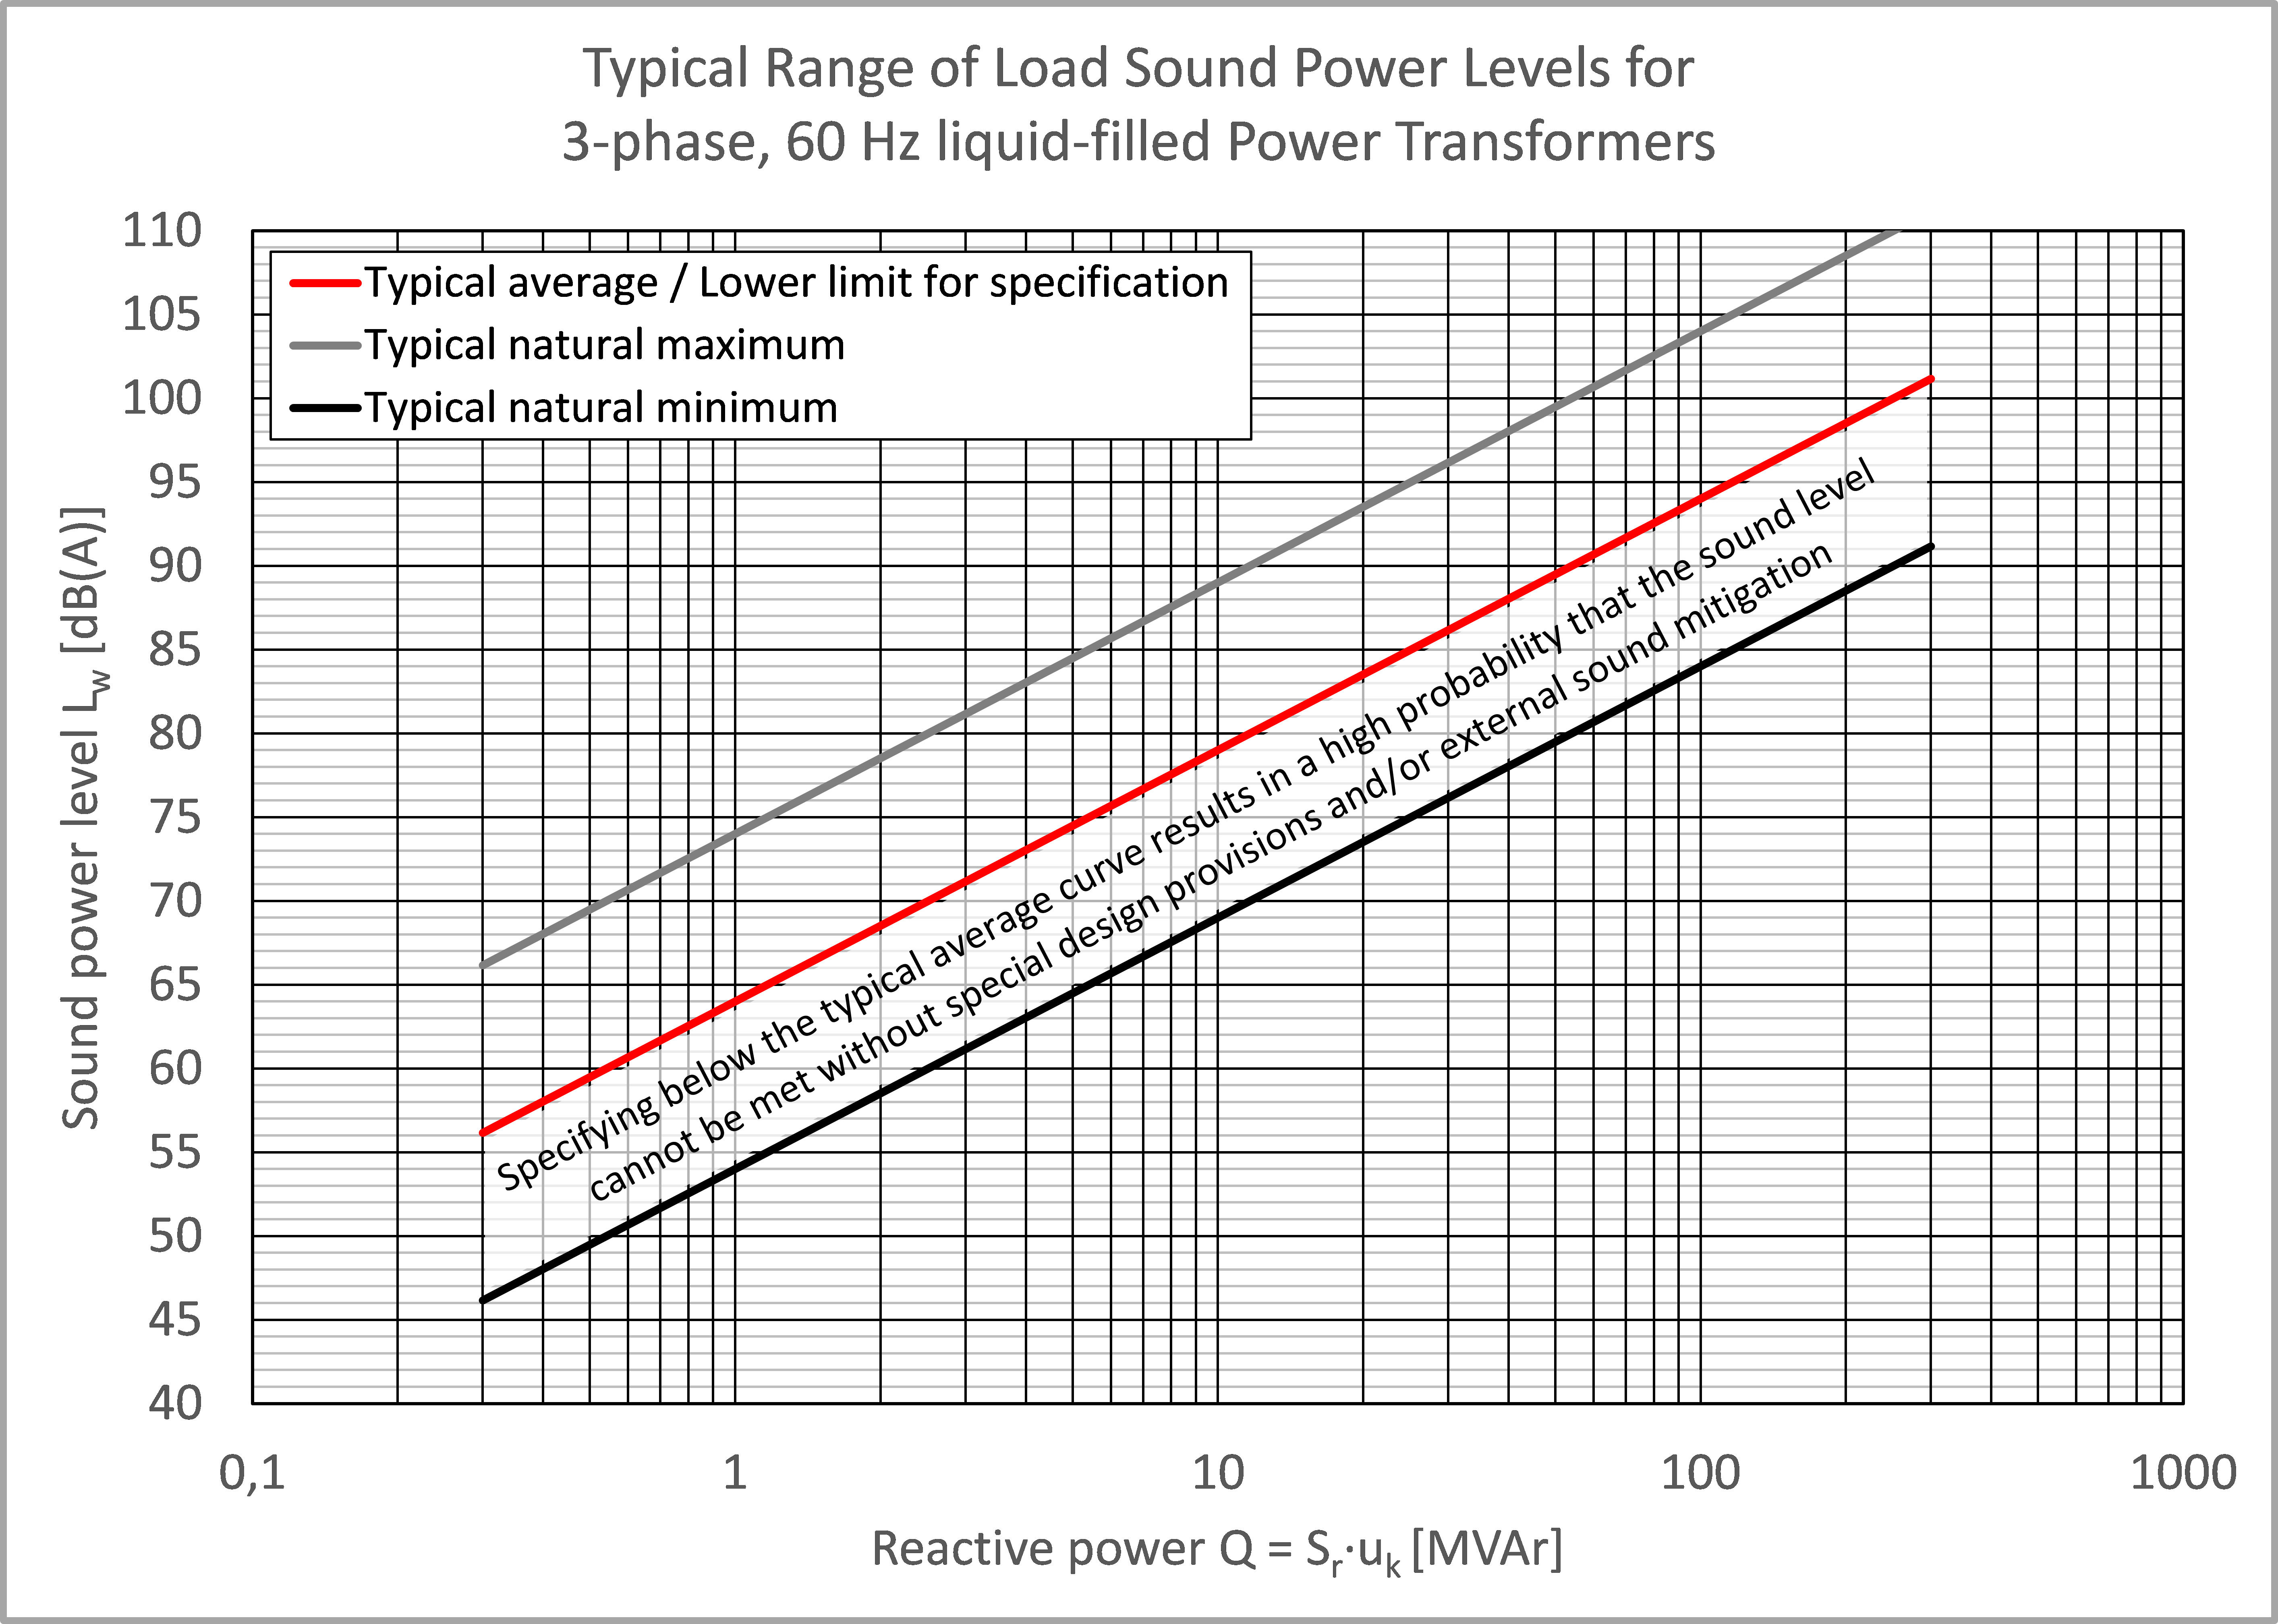
Figure 8 - Load sound power level curves for specification: Three-phase 60 Hz transformers
Load sound power level at transformer loading S other than Sr
As outlined above, the input quantity for the load sound power level estimation at rated transformer loading with the new load sound model is the reactive transformer power at rated loading, i.e. the product of Sr and uk. To calculate the load sound power level at any other transformer loading condition, there are several possibilities:
- Calculation based on known sound power level at rated power by applying the so-called “40 Log” rule:
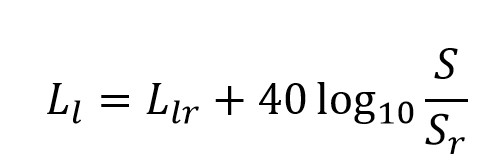
Ll - sound power level at actual loading
Llr - sound power level at rated loading
S - actual apparent power
Sr - rated apparent power - Calculation by applying the new load sound model using the actual apparent power and actual impedance voltage as model input parameter. It is worth mentioning that this methodology applies generally. Using the actual parameters S and uk for whatever transformer loading conditions (including different tap positions) will return the associated load sound power level.
- Calculation by applying the new load sound model with the input quantity Sruk being multiplied with the square of the actual loading factor.
- [1] NEMA TR 1-2013, Transformers, Step Voltage Regulators and Reactors, 2013.
- [2] E. Reiplinger, "Study of noise emitted by power transformers based on today's viewpoint" in CIGRE Internation Conference on Large High Voltage Electric Systems, Paris, 1988.
- [3] [a] C. Ploetner, "No-load sound power levels for specification purposes derived from more than 1000 measurements – a representative figure for three-phase transformers" in CIGRE Study Committee A2 colloquium, Krakow, 2017. [b] CIGRE, 9 10 2015. [Online]. Available: www.cigre.org/userfiles/files/News/2018/TOR_WG_A2_54_Power_transformer_audible_sound_requirements.pdf. [Accessed 16 March 2020].
- [4] C. Ploetner, "No-load sound power levels for specification purposes derived from more than 1000 measurements – a representative figure for three-phase transformers" in CIGRE Study Committee A2 colloquium, Krakow, 2017.
- [5] ELECTRA 302, Interim report of WG A2.54, February 2019.
- [6] IEC 60076-10-1, Power transformers - Part 10-1: Determination of sound levels - Application guide, 2016.
- [7] IEC 60076-10, Power Transformers - part 10: Determination of sound levels, 2001.
- [8] IEC 60076-10, Power Transformers part 10: Determination of sound levels, 2016.
- [9] IEEE C57.12.90, IEEE standard for Standard General Requirements for Liquid-Immersed Ditribution, Power, and Regulating Transformers, 2010.
- [10] IEEE C57.12.90, IEEE Standard Test Code for Liquid-Immersed Distribution, Power, and Regulating Transformers, 2015.
- [11] M. Pirnat en M. Gillet, "Difference between 50 Hz and 60 Hz transformer load noise levels" in CIGRE Colloquium SC A2 / SC B2 / SC D1, New Delhi, India, 2019.