Challenges for Mitigating Natural Disasters on Overhead Transmission Lines - Strong Wind
The wind-speed load estimations that reflect the effects of Japan's complex topography and meteorological phenomena can be expected in the rational wind-resistant design of overhead transmission lines (OHL). The author was revising the design standard for OHL structures in Japan, as published by the Institute of Electrical Engineers of Japan (JEC), and examined the method of creating directional basic wind speed maps. This article outlines these new maps released in 2020 and the author's study for the future advancement of wind-resistant designs.

by Yoshikazu Kitano - Central Research Institute of Electric Power Industry
Severe wind environments in Japan and revision of the design standard on structures for overhead transmission line
Approximately 75% of Japan's land area is mountainous, with some areas reaching several thousand meters in elevation. Severe typhoons strike from summer to autumn, and strong low-pressure systems (i.e., bomb cyclones and stron spring storms) hit Japan in autumn, winter, and spring. In addition, there have been many reports on topographic winds (i.e., downslope winds and gap winds) caused by large mountains and steep valleys, approaching low-pressure systems, and air density stratification. In the design of transmission lines and towers, a rational approach that fully considers the severe wind environments and economic efficiency is required.
In 2015, a new design method was proposed (the design standard on structures for OHL in Japan published by the Institute of Electrical Engineers of Japan; JEC-TR-00007-2015) based on the experience gained from many strong wind events, including the damage to transmission towers caused by Typhoon Mireille in 1991 and downslope winds. The design method focuses on the fact that the wind loads on transmission towers and lines vary greatly depending on the wind direction; the wind direction is set at a pitch of 5 degrees, the loads on towers, wires, and insulators are calculated separately, and temporal and spatial variations (i.e., non-simultaneity) are also considered to combine the loads. To apply this design method, information on return period values of directional wind speeds at the construction site is required. However, obtaining return period value information that consider strong wind phenomena in steep mountainous areas, such as downslope winds, and various cyclones was challenging.
In 2020, JEC published new directional basic wind speed maps in Japan that include the effects of downslope winds caused by large-scale topography (JEC-TR-00007-2015 Addendum 1 2020-06). In this article, the method for creating directional basic wind speed maps, which was investigated by the author and JEC committee members, is outlined in Section 1. The authors’ recent studies on further improvements in wind load estimation are described in Section 2.
Revision of design standard on structures for OHL in Japan and new directional basic wind speed maps
To estimate wind loads, it is necessary to calculate the return period values based on long-term wind speed data. In Japan, approximately 150 long-term wind observation sites cover about a 70-year period. However, they are mainly located in urban and plain areas, and are insufficient for the design of transmission towers, which are often located in mountainous areas. Therefore, as an alternative to observation, use of a numerical simulation for estimating return period values throughout Japan was studied.

Several requirements must be satisfied when using numerical simulations. First, in some mountainous areas with elevations of several thousand meters, it is desirable to reproduce the effect of vertical air density stratification and consider downslope winds on the mountains’ lee slopes. Therefore, we used a meteorological model, specifically the weather research and forecasting (WRF) model, which can reproduce these phenomena with appropriate model settings. However, the strength of downslope winds varies depending on meteorological conditions, such as wind speed, wind direction, density stratifications, and atmospheric pressure patterns. It is difficult to obtain representative values for wind-resistant designs based on calculations under limited meteorological conditions. Therefore, to consider various meteorological conditions, their frequencies, and the complex topography of Japan, we use a long-term meteorological calculation (1957-2019) with a horizontal resolution of 5 km and statistically calculated the return period values of wind speeds. In recent years, with the development of computer resources, large meteorological calculations have become possible. However, meteorological models still have technical challenges in accurately analyzing high wind speeds. Therefore, the spatial distribution of the simulated return period value was corrected by the value estimated from the observation data, and the results were used as basic wind speed maps. Basic wind speed maps were produced for each of the eight wind directions (N, NE, E, SE, S, SW, W, NW), allowing the designer to consider the directional variation. In fact, the mountainous areas have a very large wind speed due to wind direction, so the map use is expected to lead to a rational complex topography design.
Future works for map upgrading
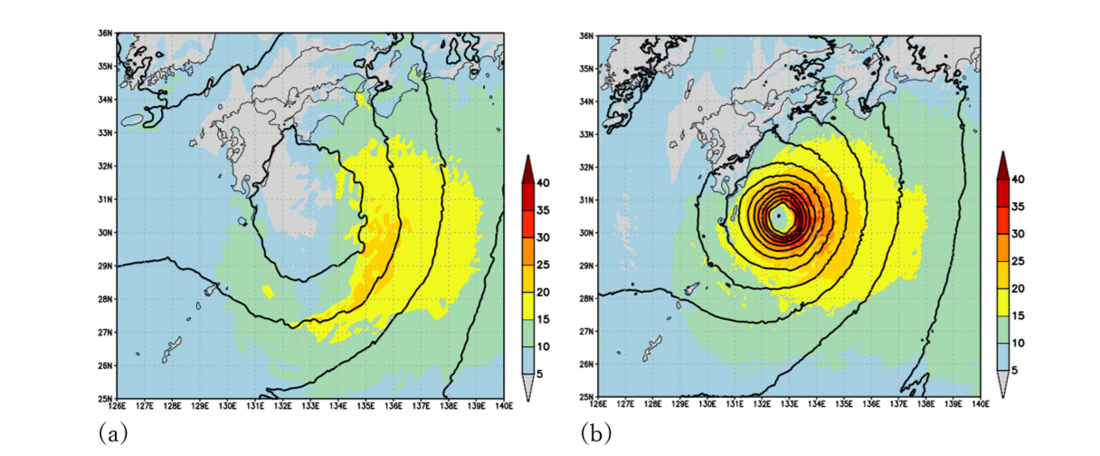
By improving the accuracy of the simulated wind speeds, more precise maps with smaller contributions from corrections using observational data can be produced. Therefore, we have begun studies to optimize various settings and parameters, such as updating the global reanalysis, which is the input data for the calculation, finer horizontal resolution, and optimization of the physical process models. Previous calculations tended to underestimate high wind speeds near the center of extremely strong typhoons. However a new calculation method based on optimized parameters resulted in a significant improvement (see Figure 1). Currently, we are investigating how to perform long-term calculations based on the newly optimized parameters.

Figure 1 - Simulated surface wind speeds [m/s; colors] and sea level pressure [hPa; lines] of a strong typhoon event. (a) The previous calculation, and (b) the parameter-optimized calculation

Considering the recent increase and intensification of severe extreme events, it is also important to organize procedures to properly evaluate the effects of global warming on wind speeds and implement them in wind-resistant design. We analyzed the simulation results of future climate projections by the Intergovernmental Panel on Climate Change (IPCC) and Japanese meteorological and academic organizations and investigated future changes in return period values. Note that the simulation results contain biases, and uncertainties exist in the global warming scenarios. We aim to establish a bias correction method applicable to critical severe phenomena in wind-resistant design and devise a reliable design method based on the uncertainty of the scenarios.
We hope to achieve a highly accurate simulation of wind speeds and incorporate global warming effects into the design, which will be reflected subsequent revisions to the JEC standard.
Thumbail & banner: NOAA on Unsplash


