Converter transformer failure survey results from 2013 to 2020
CIGRE Study Committee B4, Advisory Group (AG B4.04) collects reliability performance data on HVDC systems in commercial service every year. The information is compiled and presented at the CIGRE Paris biennial technical sessions and is used for planning, design, construction and operation of HVDC systems.
Convenor
(CA)
L. CROWE
Secretary
(CA)
M. BENNETT
C. BARTZCSH (DE), S. BHATTACHARYA (IN), N. DHALIWAL (CA), Y. FU (NL), N. KIRBY (US), K. AKMAN (SE), X. LI (CA), J. BORROWS (US), N. MACLEOD (UK), P. TAIAROL (CA), S. SANTO (BR)
Introduction
The results of the performance survey have shown that converter transformers failures are the largest contributor to the forced energy unavailability of the HVDC systems. The first joint task force formed to investigate the reasons for converter transformer failures was JTF 12/14.10-1. The JTF 12/14.10-1 conducted a survey of transformer failures up to 1990. The second task force TF B4.04/A2-1 to further monitor the performance of converter transformers was formed in 2000. This task force conducted a survey of transformer failures from 1991-2002. As per recommendation of TF B4.04/A2-1 a joint working group JWG A2/B4-28 was formed. AG B4-04 conducted five more surveys every two years between 2003 and 2012. The results of the surveys conducted between 2003 and 2012 were published in CIGRE Technical Brochure 617, April 2015.
AG B4.04 conducted four more surveys between 2013 and 2020. This Technical Brochure provides detailed information collected on HVDC transformer failures from 2013 to 2020.
The last two surveys also included reports from VSC systems whereas all previous surveys were related to LCC system only.
These surveys also include the performance of converter transformers in +/-800 kV HVDC systems
The results of all the above surveys including those from 2013 to 2020 are summarized in this brochure.
Failure surveys
The surveys were conducted by a questionnaire sent to each system owner. A copy of the latest questionnaire is included in the technical brochure. The technical brochure summarizes the results of all the transformer failure surveys and provides detailed information for failure surveys from 2013 to 2020. The details of the previous surveys can be found in references [1], [2], [3] and [4].
Apart from the general pertinent data, a description of the failure was requested, together with the apparent cause(s) as identified by the utility and/or by the manufacturer and the relationship, if any, with the factory type/routine tests performed on that unit. The survey did not cover external bushing flashovers related to pollution.
It should be noted that the systems that did not have any failures were also requested to return the survey marked as “NO FAILURE”. This information is important for determining overall performance of the HVDC transformers.
Failure definition
For the purpose of the surveys, the failures were defined as actual and preventive.
Actual failure
A failure was considered to be actual, if removal of a unit from service was required due to the damage of the active part.
Prevent failure
A failure was considered as preventive if the unit did not actually fail but was taken out of service to repair active parts following diagnostic testing such as dissolved gas-in-oil analysis (DGA), high insulation power factor, or failure of similar unit(s).
Failure categories and causes
The JTF 12/14.10-01 report classified the failures in the category of failure with the most likely cause as follows:
| Category of failure | Most likely cause |
|---|---|
| A- Bushings | 1- Mechanical |
| B- Valve Windings | 2- Dielectric |
| C- AC Winding | 3- Thermal |
| D- Static Shield | 4- Induced Current |
| E- On-load Tap Changer (LTC) | 5- Operational Error |
| F- Core and Magnetic Shields | 6- Unknown |
| G - Internal Connections and Leads |
For purpose of consistency the subsequent reports followed the same format.
Failure rate
The failure rate is calculated as follows:
Due to insufficient technical data made available in these surveys, for the purpose of this analysis it was not possible to determine the actual causes of individual failures nor was it possible to identify some general trends. The failures were classified as described in section 2.2.
Figure 1 shows the Converter Transformer failure rate history based on the combined data of surveys carried out in the following periods:
- 1972 to 1990
- 1991 to 2002
- 2003 to 2004 (reported in 2005)
- 2005 to 2006 (reported in 2007)
- 2007 to 2008 (reported in 2009)
- 2009 to 2010 (reported in 2011)
- 2011 to 2012 (reported in 2013)
- 2013 to 2014 (reported in 2015)
- 2015 to 2016 (reported in 2017)
- 2017 to 2018 (reported in 2019)
- 2019 to 2020 (reported in 2021)
It can be observed in Figure 1 that following a reduced failure rate in the period from 1991 to 2002, there was a significant increase in the period from 2003 to 2006 (2005 and 2007 report). The failure rate in last three reports (2009 to 2019) decreased to same level as the rate recorded for the period 1991 to 2002. Failure rate in 2019 and 2021 reports is less than 0.006. In addition, majority of these failures are on systems more than 25 years old.
This finding is encouraging, indicating a potential effect of the latest version of the IEC 61378-3 [5] standard as well as a strong action that followed an upsurge of the HVDC Converter Transformers caused to a full or a partial extent by corrosive oil.
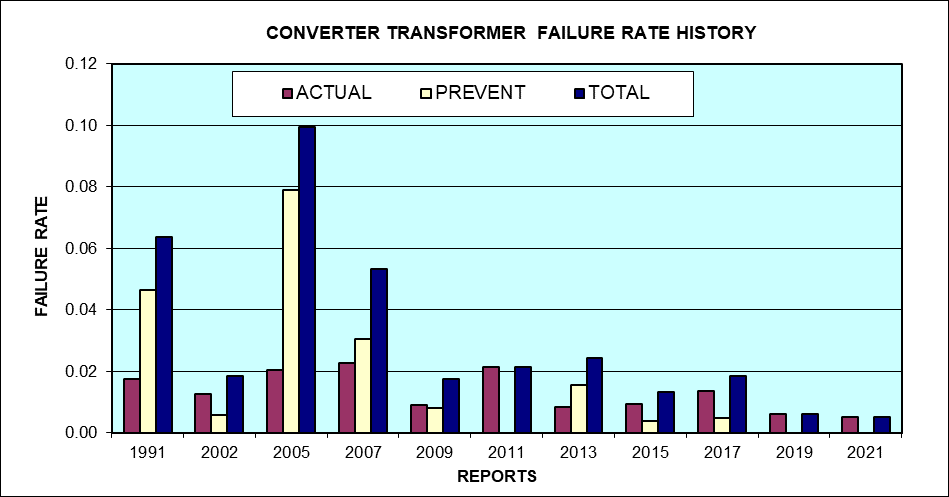
Figure 1 - Failure Rate for the period 1972 to 2020
Table 1 shows the failure rate of some of the systems commissioned between 2006 and 2020.
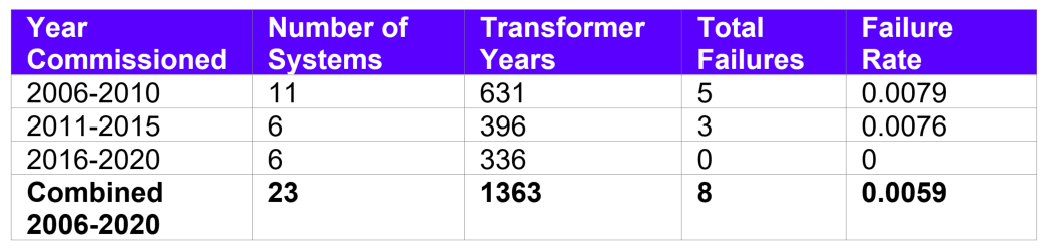
Table 1 – Transformer Failures on Systems Commissioned Between 2006 and 2020
The survey results show that the failure rate of the systems installed after 2005 is very low. So far, the systems installed between 2016 and 2020 have not reported any failures. Five out of six systems installed between 2016 and 2020 are at 800 kV level.
The Technical Brochure contains more information on failure trends based on the following criteria:
- Failure rate based on year of commissioning
- Failure rate based on transformer tank configuration.
- Failure rate by component
- Consolidated failure rate.
In addition Technical Brochure contains information about which systems suffered transformer failures and the also the ones that did not.
- [1] CIGRE JTF 12/14.10-01; “ In service performance of HVDC Converter Transformers and oil-filled Smoothing Reactors”, Electra, No. 155, August, 1994, pages 6 – 30: e-cigre.org/publication/ELT_155_1-in-service-performance-of-hvdc-converter-transformers-and-oil-cooled-smoothing-reactors
- [2] CIGRE JTF B4.04/A2-1; “Analysis of HVDC Thyristor Converter Transformer performance”, Brochure No. 240. 2004 : e-cigre.org/publication/240-analysis-of-hvdc-thyristor-converter-transformer-performance
- [3] CIGRE JWG A2/B4-28; “HVDC Converter Transformers- Design Review, Test Procedures, Aging Evaluation and Reliabliity in Service”, Brochure No. 406, February 2010: e-cigre.org/publication/406-hvdc-converter-transformers---design-review-test-procedures-ageing-evaluation-and-reliability-in-service
- [4] CIGRE Technical Brochure 617, “HVDC LCC Converter Transformers – Converter Transformer Failure Survey Results from 2003 to 2012”, AG B4-04, April 2015: e-cigre.org/publication/617-hvdc-lcc-converter-transformers---converter-transformer-failure-survey-results-from-2003-to-2012
- [5] IEC 61378-3, Ed. 1.0; Converter Transformers, Part 3- Application Guide, 14/487 CDV, April 2006.

Other Technical Brochures