Using Lidar Scanning to Measure or Identify Electrical Conductors
Electrical conductors on energized transmission or distribution lines can now be measured faster, safer and cheaper using high-density lidar scanning, according to a case study and test trials conducted by Burns & McDonnell engineers. Conductor measurements are sometimes needed by utilities to identify transmission lines, distribution lines and bus works. Most commonly, this is when their records are outdated, conflicting or — in some cases — nonexistent.
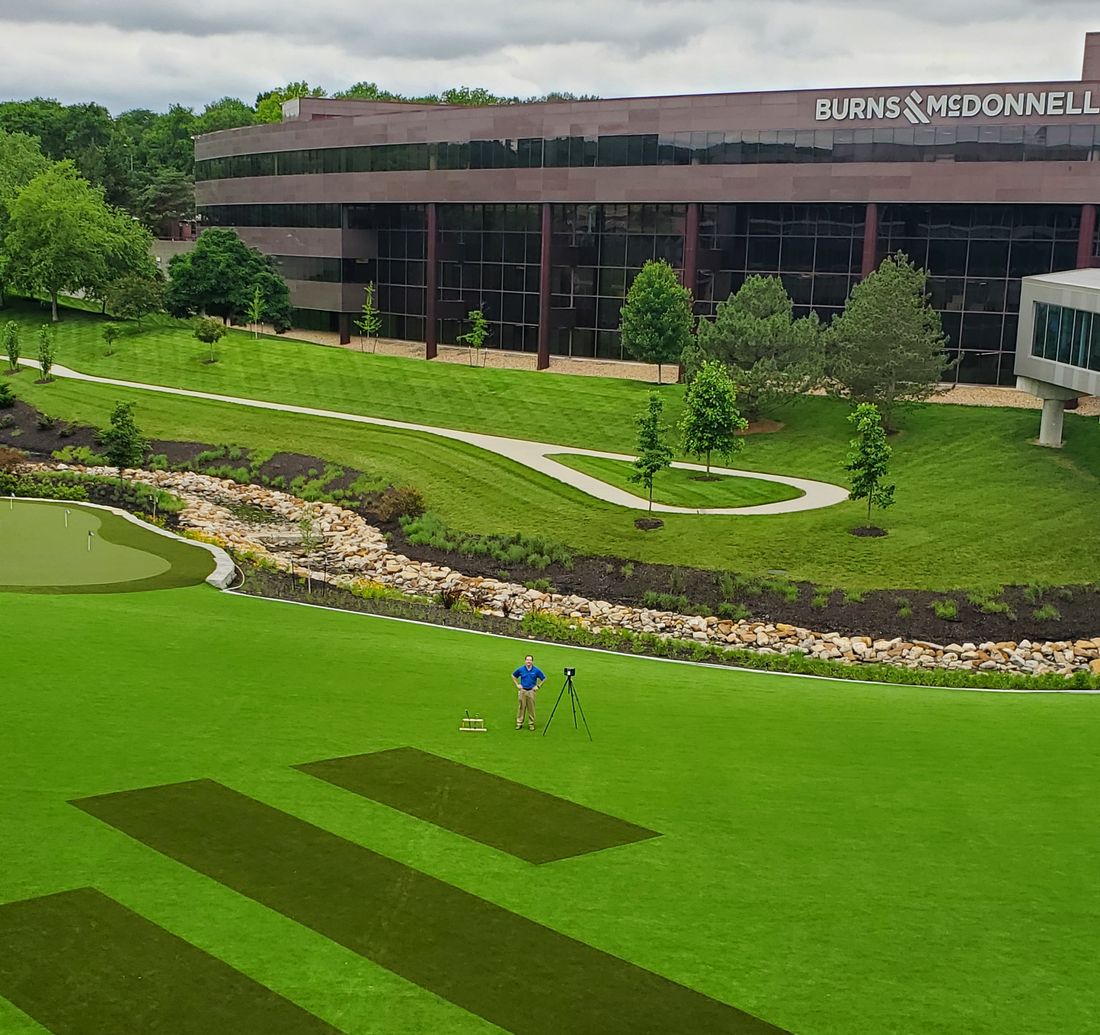
Brian Obermeier collecting lidar scan data
By Brian Obermeier, and Alan Washburn
PE, Burns & McDonnell
Measuring the diameter of a conductor elevated 50 feet (15 meters) in the air, however, is not easy. Many range from 1 to 2 inches (25 to 50 mm) in diameter, with some differing by as little as 1/100 of an inch (0.254 mm). Utilities today rely primarily on mechanical calipers to complete these measurements, but only after first de-energizing the substation and using a lift or ladder to access the conductor.
A recent case study and test trials found that, under defined conditions, terrestrial lidar scanning — a remote-sensing method that uses light pulses to measure distances — can be used instead.
Based on the findings, lidar scanning can be used to eliminate safety concerns and downtime from the conductor measurement process. The trial results also provide insight into scanning distances, angles and other parameters that produce the best measurement results with the least scanning investment.
A Learn-As-You-Go Testing Methodology
The original plan was to collect conductor measurements from existing 3D substation models created by stitching multiple lidar scans together. However, that plan was shelved after finding that the stitching process complicated the measurement of individual conductors. Experience had shown that normal-resolution lidar scans are not dense enough to produce consistent conductor measurements.
This led researchers to high-density lidar scanning, which measures the point-to-point distance between the scanner and a specific surface millions of times and boosts accuracy by increasing the number of data points. However, scanning an entire station with high-density scans is impractical, given that each scan takes more than an hour, and even small substations would require 10 or more scans.
Upon the recommendation of the scanner manufacturer, the team learned to focus high-density scans solely on a line’s conductors, a process that could be completed in minutes. The manufacturer also recommended that scans not be conducted directly below a conductor. Scans conducted on either side were found to be more accurate.
The First Field Test
The team first tested high-density lidar on behalf of a utility client that was concerned about a potential inconsistency on its drawings. The utility wished to determine if a particular transmission line conductor was a 1590 AAC or a 1033.5 ACSR, whose diameters differed by a little more than 0.25 inch (6.35 mm).
The field measurement was performed by combining typical lidar scanning methods with middle-of-the-road resolution. Several high-density scans of the conductor were then completed before FARO SCENE software was used to register the scans and the Certainty 3D TopoDOT tool within MicroStation software was deployed to measure its diameter.
The project was a success, with the results confirming that the conductor’s diameter was, in fact, closer to that of a 1590 AAC conductor. Confidence in the results was bolstered when the same methods were successfully deployed to measure a known conductor within the substation.
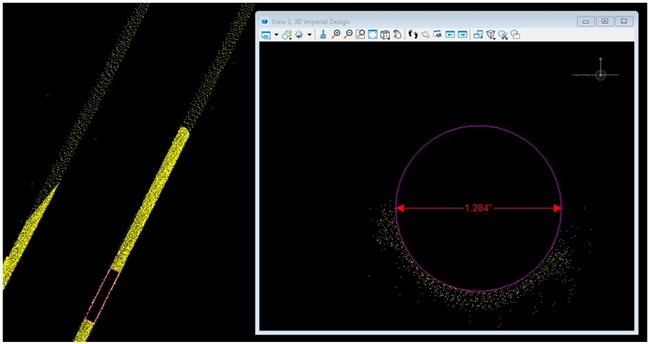
High vs. low density scanning
The Search for Best Practices
With the effectiveness of the application confirmed, the next challenge was determining the parameters for completing the process efficiently and accurately. The initial plan was to obtain all essential measurement data from a single scan.
When that proved insufficient, combinations of two, four and six scans taken from various distances and angles were tested. This approach would make it possible to collect sufficient data while minimizing the “noise” around scan edges and errors created when scans were subsequently stitched together.
The team next used high-density lidar scans to measure two conductors of different diameters from various distances and angles in a simulated environment. Two conductors (1272 ACSR and 1590 AAC) were placed in a wooden frame in an open field. A centerline was identified, with points indicated at the 50-, 80- and 110-foot (15-, 24- and 33-meter) marks from the conductors. Perpendicular to the centerline, scanning points were identified at multiple distances from these marks (see Figure 1).
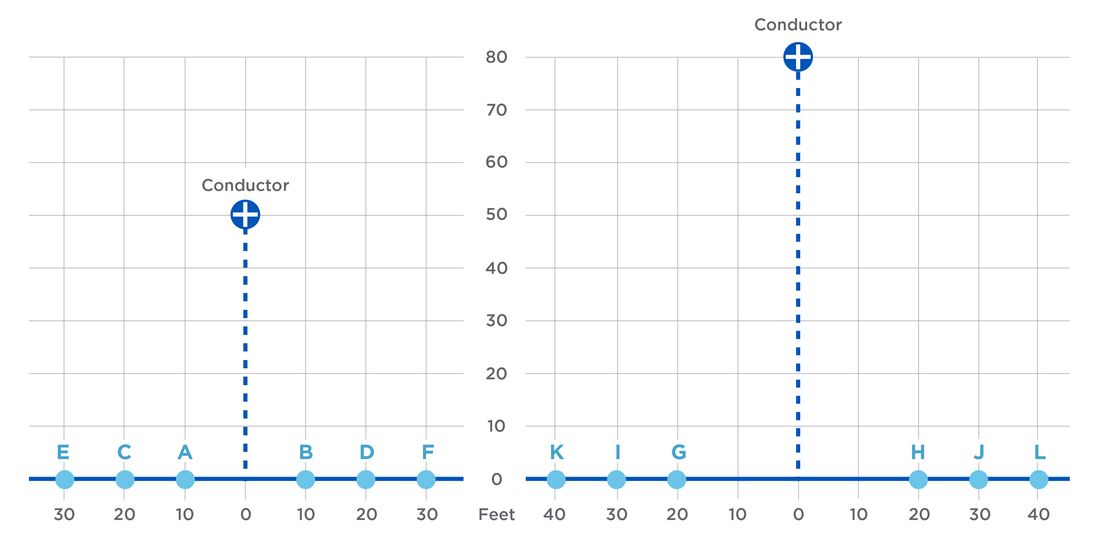
Figure 1
A series of high-density scans were taken of each conductor from two, four or six scan points (see Table 1).
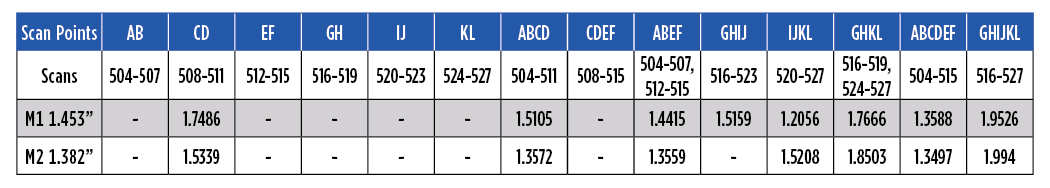
Table 1
Initially, scans were registered together using the “automatic registration” function found in SCENE software. When that resulted in misalignment among conductor scans, the team switched to the “manual registration mode,” which provided the control needed to improve scan overlap accuracy and focus on the specific points that mattered most.
Once the scans were registered, the FARO AsBuilt “fit bent pipe” tool in Autodesk AutoCAD Plant 3D was used to find a best-fit conductor circumference and measure the diameter of the conductors.
Scans taken from the simulated 110-foot (33-meter) centerline proved to be not dense enough to be used by the tool. Similar results occurred when combining two scans from the 80-foot (24-meter) centerline. While some distances and angles produced less-than-satisfactory results, others produced the readable results the team sought.
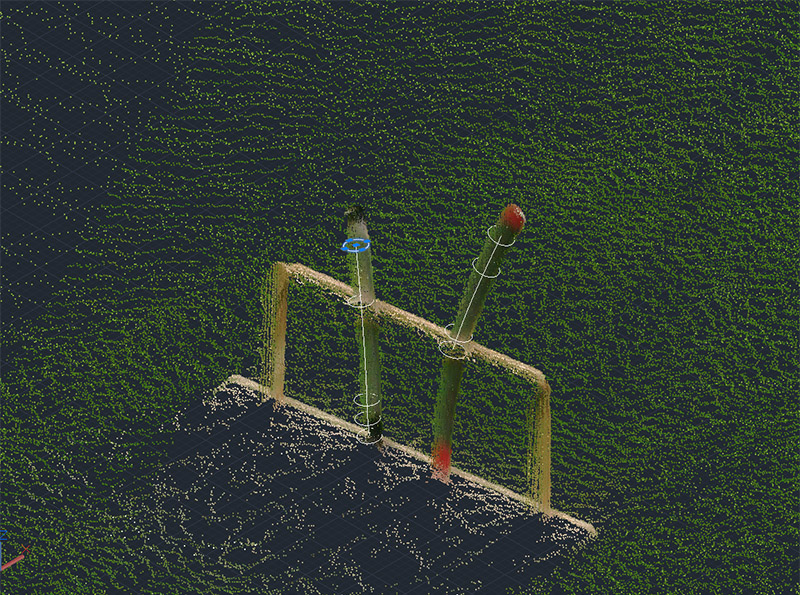
Bent pipe tool measuring diameter of conductor from scan points ABCD (See Table 1)
A Safe, Time- and Money-Saving Alternative
This exercise demonstrated that focused, high-density lidar scans can be an effective way to measure conductor diameter, which can differentiate between and identify different types of conductors. Manual registration of scans proved more effective for data preparation than automatic registration.
The number of scans needed to achieve accurate results increased as the distance between the scanner and the conductor grew, at least to a point. Measurements taken from 50 feet (15 meters) required just two scans to achieve the necessary density, while those from 80 feet required four scans. Scans taken from 110 feet proved insufficient even with four or six high-density scans.
Data registered using four scans provided the most appropriate density without oversaturation or excessive noise in the data. Clusters of four scans taken at the 80-foot distance were within 0.2 to 0.5 inch (5 to 12.7 mm) of the conductor’s actual diameter. Those taken at the 50-foot mark were within 0.1 inch (2.54 mm). On measurements involving six scans, the process of stitching scans together resulted in enough noise to invalidate the results.
Best Practices
While utilities likely cannot leverage existing scans to obtain conductor measurements, they can obtain the data they need by making modest adjustments to their scanning methodology. Those using lidar for this purpose will have greater confidence in their results when:
- A conductor is elevated no more than 50 feet. (Most sites meet this parameter.)
- Scans are performed at approximately 15° and 25° angles from either side of the conductor.
- Four scans are performed on conductors that are more than 50 feet in the air. At lower heights, two scans may be sufficient.
- Utilities identify the possible conductors to match before conducting scans. If options are particularly close in size, the level of accuracy that lidar scanning provides may be insufficient.
- Similar scans are performed using the same distances and methods on a known conductor in another area of the substation.
Suggested content