Application and benchmark of multiphysics simulation tools for temperature rise calculations
The development of medium voltage (MV) and high voltage (HV) switchgear comes along with a bundle of simulation and testing tasks to ensure a safe and reliable operation of the equipment over several decades. During normal operation as well as in case of short-circuit events the temperature inside the switchgear rises above ambient level. To prevent accelerated ageing of the equipment, temperature rise limits are given in the standards, depending on the used insulating media. The optimization of existing as well as the development of future switchgear require the knowledge to predict the temperature rise of the equipment during the different iterations of the development process.
Convenor
(CH)
M. KRIEGEL
Secretary
(NO)
A. PEDERSEN
E. FJELD (NO), P. GREGOR NIKOLIC (DE), T. KRAMPERT (DE), M. WEUFFEL (DE), S. SINGH (NO), S. WON PARK (KO), Z. LI (CH), M. RESCH (DE), S. BARRIO (ES), S. FEITOZA (BR), T. TSURUTA (JP), J. SNAJDR (DE)
Objectives of this Technical Brochure
Temperature rise simulation deals with different physical domains describing heat generation and heat dissipation effects. Simulating electromagnetic effects and modelling of resistances (bulk and contact) are needed to determine the power loss. Cooling depends on radiation, convection and conduction. Therefore, multiphysics tools combining electromagnetic simulation and CFD are state of the art for simulating temperature rise tests.
WG A3.36 was established to benchmark multiphysics simulation and simplified engineering tools for temperature rise simulation, to describe the state-of-the-art techniques regarding MV and HV switchgears and to defining the critical parameters that affect the accuracy of thermal modelling.
Contents of the Technical Brochure
One chapter of the TB provides an overview of relevant standards and technical reports related to temperature rise in high-voltage switchgears and controlgears. The ability to carry the rated nominal current without exceeding the allowed temperature rise limits is demonstrated in a temperature rise test, which is a mandatory type test. The procedure of the temperature rise test and the criteria to pass the test are described in IEC 62271-1. The specific standards for the switching devices (100 – 199) and switching installations (200 – 299) refer to the IEC 62271-1. Most of the standards refer without any additions to test limit values or test procedures. However, they may include some additional testing requirements. Although many of the national standards follow the IEC standards, different values can be found. IEEE standards, Japanese standards and Chinese standards are compared with IEC.
IEC 62271-1 does not mention the use of simulations in connection with temperature rise tests. Therefore, a manufacturer cannot today meet the international standard without reporting results from an experimental temperature rise test. On the other hand, IEC TR 62271-307 opens for simulations in the analysis of design criteria (when comparing a new design with an already tested variant). However, the IEC standards do not provide guidance in terms of simulation validation, simulation methods, simulation tolerances etc.
The TB describes the effects of heat generation and heat dissipation. While heat generation is mainly driven by current and the related power losses, the heat dissipation or cooling depends strongly on the design of the particular switchgear. In order to understand the heat dissipating conditions a brief overview of the heat transfer for a metal enclosed switchgear is given.
The current path experiences a temperature rise during normal operation due to ohmic losses. In addition to the losses a DC current generates, an AC current might generate additional losses in the conductors (skin effect and proximity effect) and in the enclosure. The temperature difference between the current path and the surroundings is the driving force for the heat transfer. At steady state conditions, the generated heat is transferred to the surroundings by conduction, radiation and convection. The three transfer mechanisms are illustrated in the schematic drawing shown in Figure 1.
First, the heat transfer inside the enclosure is considered. Heat is transferred by conduction from the hot spots (e.g. contacts) to cooler parts of the current path (e.g. busbars and cables). The gas inside the switchgear is heated due to convective heat exchange with the current path. Buoyancy causes convective movement of the internal gas, which transfers heat to the inner walls of the enclosure. In addition, all parts inside the enclosure with an overtemperature will transfer energy to the inner walls of the enclosure by radiation.
Second, the heat transfer from the enclosure to the ambient has to be considered. The heat is transported by conduction across the enclosure walls. If the enclosure is hermetically sealed, cooling of the enclosure can only be achieved by heat transfer from the outer walls to the surroundings by radiation and convection, as shown in Figure 1.
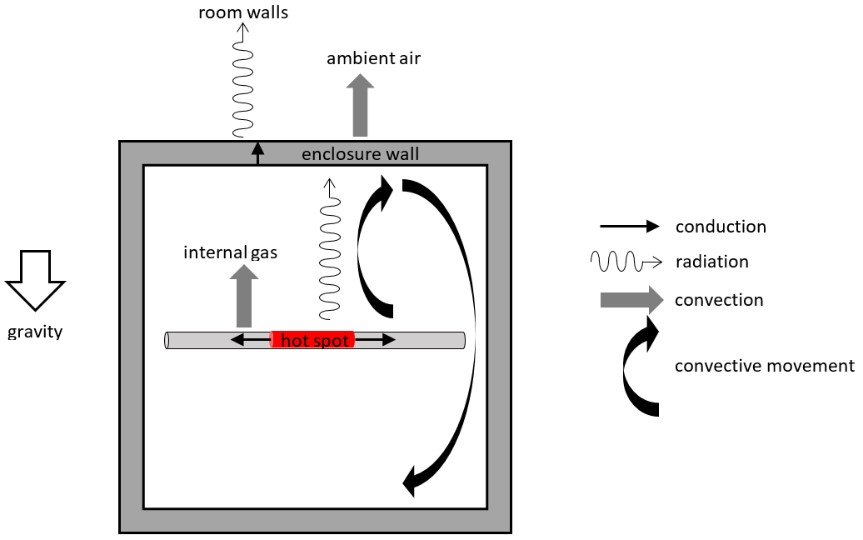
Figure 1 - Heat transfer inside and outside a sealed switchgear enclosure
The TB describes methods that are typically used to calculate the temperature distribution inside medium and high voltage equipment, such as Simplified Methods, Thermal Network Models (TNM) or Computational Fluid Dynamics (CFD). These methods are usually used in the different design process phases (i.e. simplified methods as first approximation for quotation and TNM and CFD during the design of the equipment). In addition, these methods are also used together. For example, results form a CFD analysis is often an input to the TNM. Typical example of a simplified method as well as TNM and CFD are described.
Main part of the TB is on the benchmark study. Some members built up manufacturer independent devices, which reproduced typical effects occurring in medium voltage (MV) and high voltage (HV) equipment, while other members from the working group simulated the temperature rise in advance to tests. Tests on the benchmark devices were performed at laboratories of universities, as independent parties.
The devices, which are shown in Figure 2 and Figure 3, are designed to cover most relevant effects related to heat generation and heat dissipation.
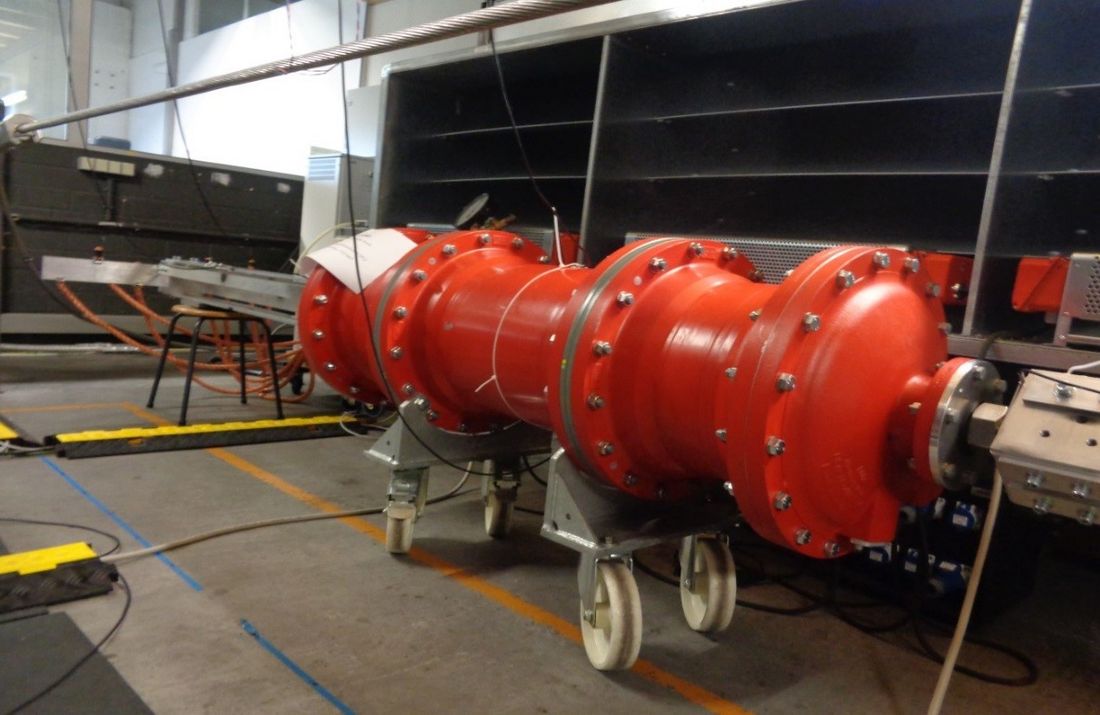
Figure 2 - MV Test device
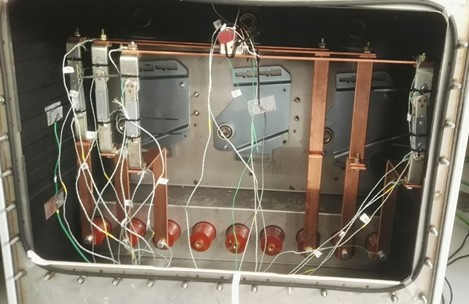
Figure 3 - MV Test device with thermocouples
Both benchmark devices were set up by the working group. Instead of taking an existing product, the devices were designed by the working group to be manufacturer independent. Thus, the performances of the devices were unknown to all members.
In order to assess the simulation accuracy, the results are compared to each other and to the measurement results. Deviations between the simulation results as well as between experiment and simulation are discussed.
Main results
The simulation results on the HV test device are shown in Figure 4. The simulation results can be clustered into three groups as illustrated by colored curves. The red curves show simulation results that predicts a temperature rise of about 60K while the blue curves are at 50K and the green curves give roughly 40K. With one exception all curves do show similar temperature profiles along the current path. The hot spot is always predicted to be in the center of the device. Simulated temperature rise of the hot spot varies between 40K and 70K.
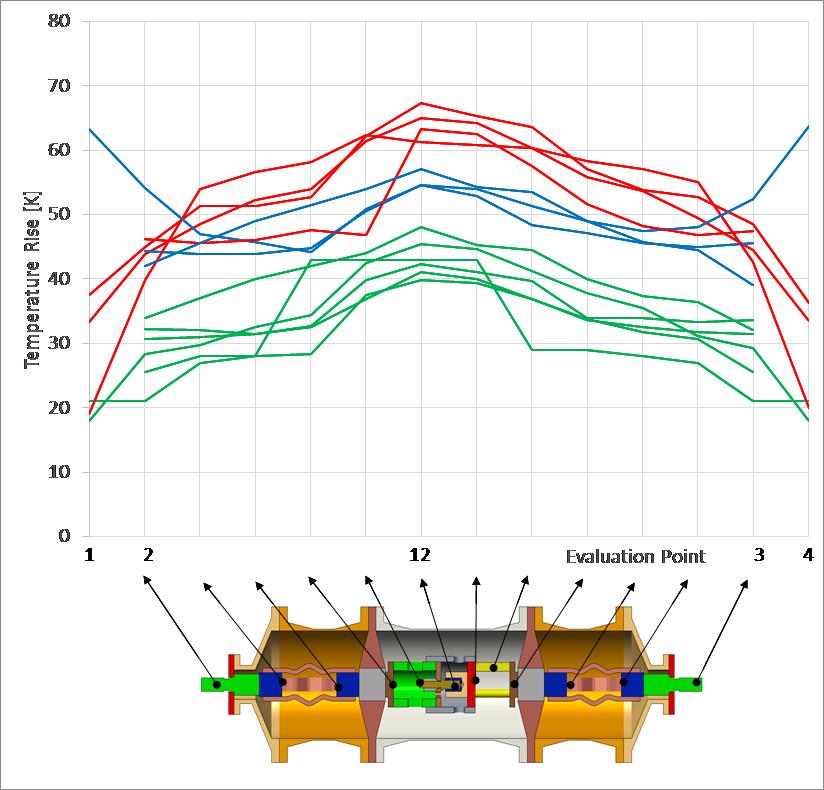
Figure 4 - Comparison of the simulation results for the high voltage test device
Figure 5 shows one example of the simulated temperature distribution of the MV benchmark case. The maximum temperature occurs on the knife contacts.
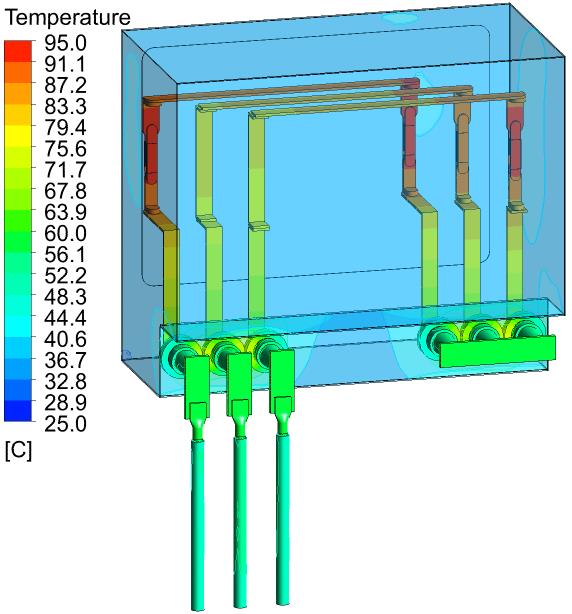
Figure 5 - Example of simulated temperature distribution
Figure 6 summarizes measured and simulated temperature rise on the MV test device. Results from two of the simulations have maximum temperature rise higher than the measured values. The other simulations have maximum temperature rise lower than the measurements. All simulated curves show similar temperature profiles as the measured result along the current path. The hot spot is in the region of the open/close knife contacts. However, it is a deviation between the lowest calculated hot spot 63 K to the highest calculated hotspot 105 K. The simulated temperature rise of the hottest spot was from 70 % to 117 % of the measured value of 90 K.
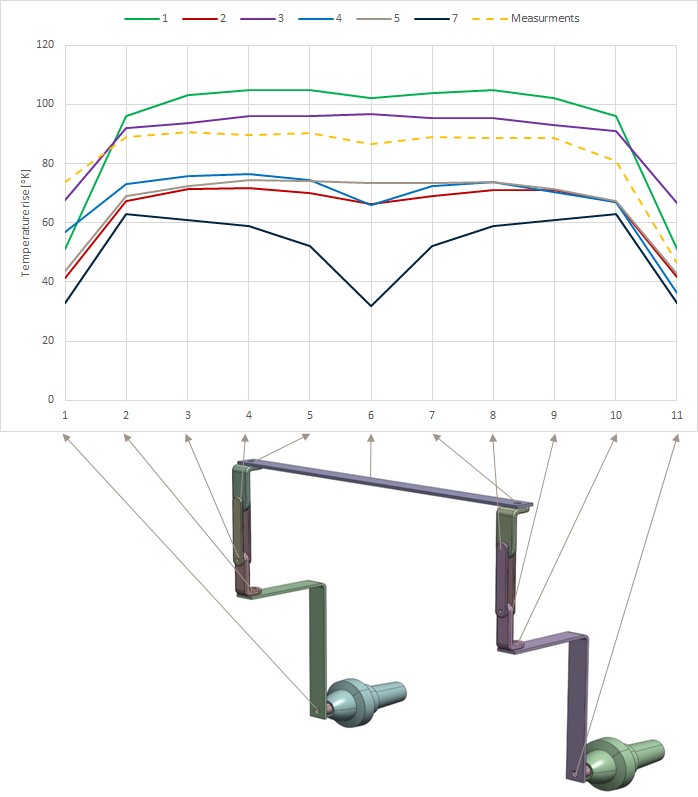
Figure 6 - Simulated and measured temperature rise on the L1 phase on MV test device
Heat generation and heat dissipation modelling was analyzed to explain differences in the simulation results.
Differences in heat generation modelling was analyzed by comparing overall resistance and calculated power loss. The bulk resistance can be easily calculated. A more challenging task is to calculate the AC losses. However, it was discussed that the impact on the temperature rise is less than for contact resistance, especially for the test device with a high portion of contact resistance. An accurate determination of contact resistances in advanced to the test was identified to be the most challenging task. The Working Group concluded:
- Best practice to set contact resistance is to adjust the values to sum up together with the bulk material to fit the measure resistance of the whole device;
- the overall resistance has a stronger impact on the simulation result than the individual contact resistances;
- Contact resistances are almost impossible to measure as they change over time or during load. Repetition of measurement on the same device showed big variations while the overall resistance showed a more stable value;
- If sum of contact resistances is high against the bulk resistance it is important to have a good estimate;
- Contact resistance are big uncertainties and sources for errors during power loss simulation.
Spread in the simulation results are assessed to result also from different modelling of heat dissipation effects. However, once the model is adjusted to the test device, the prediction e.g. of changing loads might be done with high accuracy.
Although the test device distinguishes from a real high voltage equipment the benchmark unveiled major aspects that need to be considered when performing temperature rise simulation. Single contact resistances changes over time, due to current load and might vary even using the same assembly procedure. In addition, they can hardly be measured directly and are less important as direct simulation input. They can be more precisely derived from the overall resistance measurements and bulk resistance calculation. While typically products or their components are known to the manufacturer, the test device distinguished from a real high voltage device it therefore was an unknown device to all members prior to simulation. The deviation from a real device as well as the deviation from typical temperature rise values made the simulation very challenging.
However, the benchmark demonstrated that when contact resistance estimates are reliable power loss simulation seems to be very reliable with an accuracy down to 10%. While DC losses are straight forward to be calculated, the simulation of AC losses is more demanding.
Differences in heat dissipation modelling was analyzed by looking at temperature rise versus power loss. While a good accuracy in calculating the power loss is recognized, the deviation between simulation results of heat dissipation is much more.
Radiation power depends on the temperature to the fourth power, which means that the portion of radiation will increase with increasing temperature, more than convection and conduction. A good understanding and verified data are needed to adjust those parameters.
The benchmark was done as blind test, and the members were not able to validate their simulation results against the test device or a similar device. This resulted in different heat dissipation simulations, which is expected to be the main reason for the differences in the simulated temperature rise. For the HV device with unknown values of the contact resistances and emissivity coefficients prior to the simulation, the simulated temperature rise of the hottest spot was from 143 % to 239 % of the experimental measured value. For the 3-phase MV device with measured contact resistances and emissivity coefficients given prior to the simulation, the simulated temperature rise of the hottest spot was from 70 % to 117 % of the measured value.
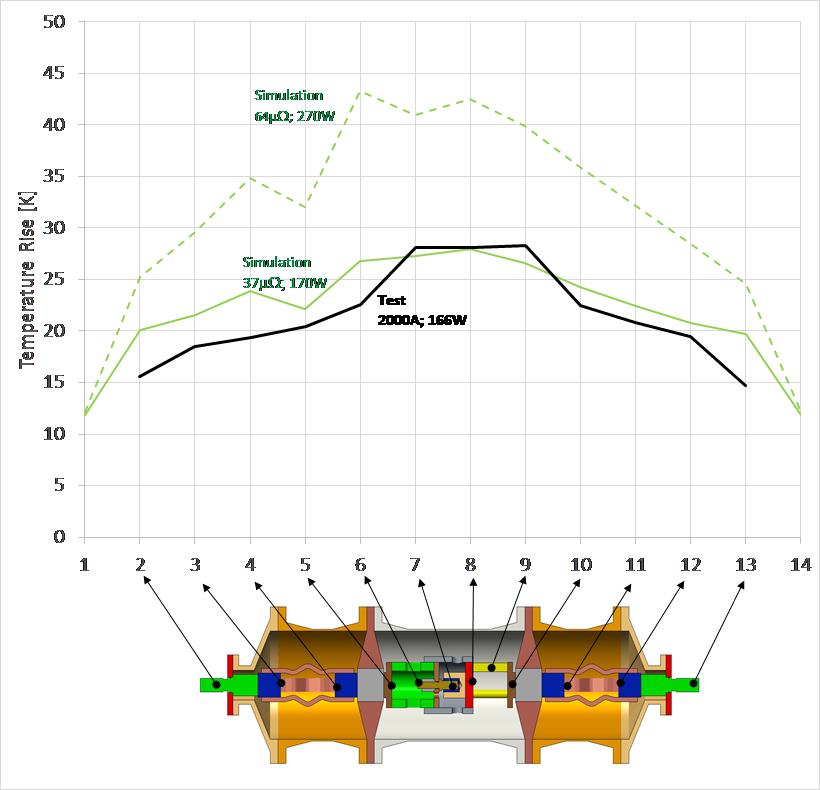
Figure 7 - Simulation with adjusted contact resistance
Conclusion
The benchmark is one more example that simulations always require verification and validation. This process happens when tools and models are continuously improved along product development. The engineer continuously gathers experience and adjust physical parameters to his design and products. Not as for the benchmark case he does not start with a completely unknown device.
The results indicate that for a completely new switchgear design, the accuracy of the temperature rise estimation is probably more dependent on the user’s experience in selecting the proper input parameters and necessary simplifications, rather than what kind of simulation tool (CFD or TNM) is applied.
Based on this study, it can be concluded that the performance prediction of a temperature rise simulation can be done when the simulation model is calibrated with previous resistance and temperature measurements. The extrapolation of temperature rise by simulation is possible in these specific cases.

Other Technical Brochures