From the ‘duck’ to the ‘dachshund dog’ curve
The penetration of Renewable Energy Sources (RES) has increased dramatically over the last decades. Photovoltaic (PV) systems are among the most preferable RES technologies, especially in countries with high solar irradiation.

By Phivos Therapontos, Dimitris Afxentiou, Rogiros Tapakis, Petros Aristidou and Mathaios Panteli
Introduction
The increased energy generation from PV systems has already significantly reduced the net-load demand (the load satisfied only by conventional units) during mid-day, creating the well-known ‘duck’ curve [1].
The significant net load reduction during mid-day has introduced several new challenges to system operators worldwide, such as frequency stability issues and reduced short-circuit levels due to the reduced number of synchronous generators necessary to supply the net load. Power systems operating with a small number of synchronised units are more vulnerable to frequency and voltage stability problems during outages. At the same time, the ramp rate requirements of conventional generation units are increased to satisfy the evening peak demand when the net load is restored due to the PV generation reduction [2].
Renewable Energy Generation Curtailments
The massive PV penetration in power systems where the load demand is relatively low forces system operators to perform RES curtailments during peak PV generation hours to balance generation and demand. This undesirable situation has a higher impact on islanded systems where exporting the excess power is impossible. At the same time, in low-inertia systems, the system operators set a strict requirement on the minimum number of synchronised units (or, equivalently, on the minimum system inertia) to ensure the system’s frequency security. This requirement increases the RES energy curtailments during low-loading conditions to satisfy the minimum technical limits of the synchronised units (also called minimum stable generation limit).
For example, Figure 1 depicts the generation profile of a low-demand period in the Spring of 2023 for the islanded Cyprus power system. When the net load reduces below the minimum stable generation limit of the synchronised thermal units (black dotted line), RES curtailments (shown in red) are performed to balance the system and ensure its stable and secure operation. This phenomenon repeats on multiple days during low- demand periods, and the frequency has gradually increased in Cyprus over the last few years.
The generation/demand imbalance will increase even more in the coming years since government policies, especially in the EU, continuously push for increased RES penetration. In contrast, a noticeable change in load demand during the problematic period (mid-day) is not likely within the decade. It is worth noting that the amount of RES curtailments is proportional to the number of synchronous generators (or, more specifically, their minimum stable generation limit) and RES installed capacity and inverse to the system load demand.
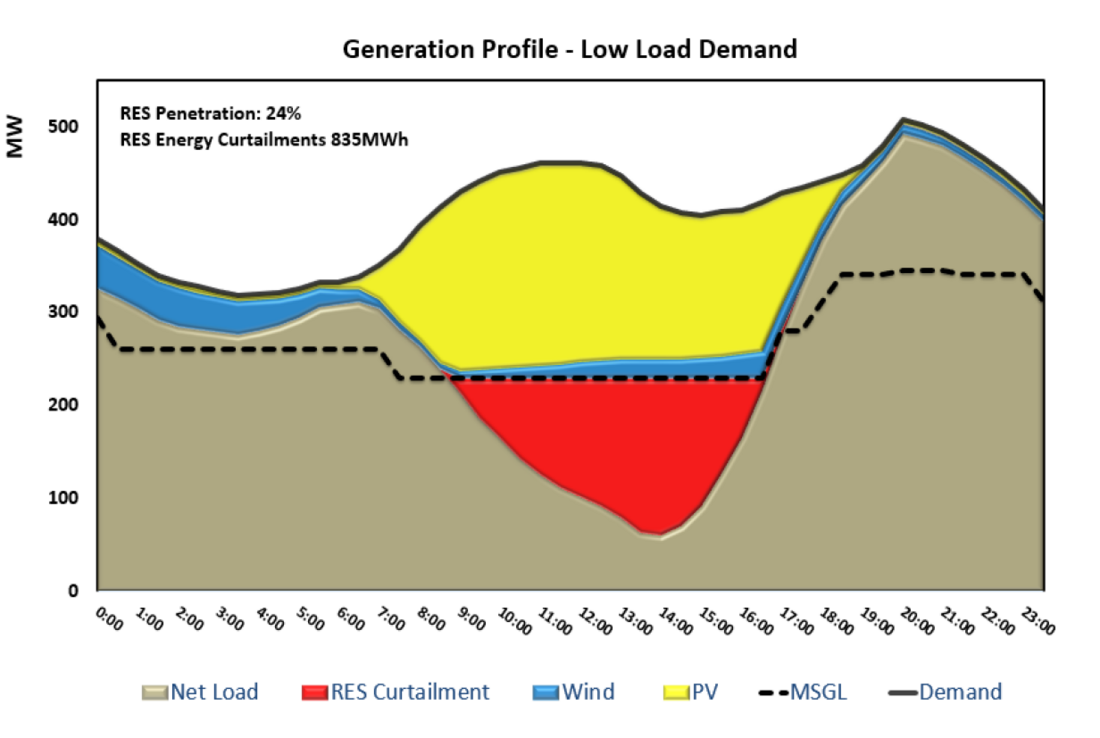
Figure 1 - RES Curtailments
The Dachshund Dog Curve
As explained above, in low-inertia, islanded, power systems (like Cyprus’ system), RES curtailments during peak sunlight hours (see the red area in Figure 1) lead to a constant net load of the system, equal to the minimum stable generation limit (MSGL) of the synchronised units. Consequently, the combination of low demand, high RES penetration, and the MSGLs, leads to the ‘duck’ curve being transformed into the ‘dachshund dog’ curve (see Figure 2).
The new curve is inspired by the basic characteristics of the dachshund dog. This dog bread has a very long straight main body and very short legs compared to its size. The latter represents the low demand of the system, which affects the amount of RES curtailment requirements. The long straight body represents the duration of the RES curtailments, which is directly related to the installed capacity of RES and the daylight hours. In addition, the dog’s head and tail can be similar to the net load evening and morning peak demand, respectively.
It should be noted that this silhouette of the net load curve occurs regularly in Cypres’ power system (and other systems with similar features) since the energy from the installed PV systems on the island is substantial compared to the system demand. This is evident from Figure 2, where the average net load curve for the first four months of 2023 is presented. It is shown that the average curve has been flattened in the mid-day because of the regular RES curtailments.
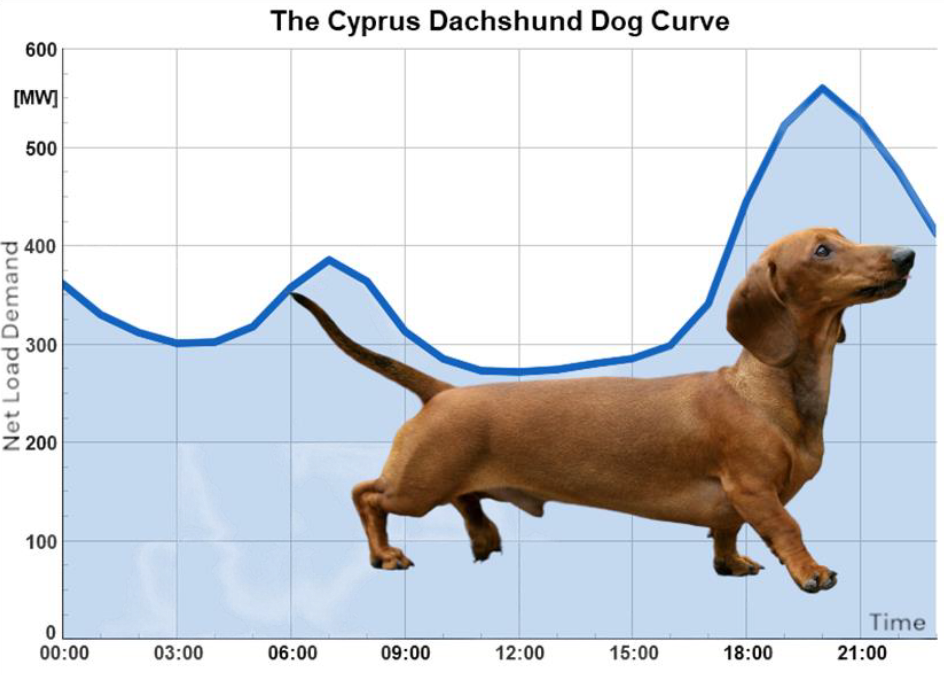
Figure 2 - The Dachshund Dog Curve
The ‘dachshund dog’ curve introduces additional challenges in the power system operation compared to the ‘duck’ curve. Primarily, RES curtailments can only be applied to controllable RES systems (i.e., that can receive remote active and reactive set point instructions from the SCADA system). Therefore, it is necessary to have an adequate percentage of controllable RES systems to ensure that the required curtailments can be applied. However, in many countries (including Cyprus), only the large RES units are controllable, while the smaller units (such as rooftop PVs) are not. In turn, the number of uncontrolled PVs should be limited or investments to control such units should be made (e.g., through ripple control or IoT devices). It should be noted that in Cyprus, the limit of uncontrollable RES has already been reached. As a result, all new RES installations, irrespectively of their installed capacity, must be controlled. Another critical issue is fairness: the curtailments must be distributed fairly among RES producers. Unfair RES curtailments will unavoidably result in a significant loss of income for some producers.
It should be noted that the curtailments and the issues mentioned above can be avoided with the use of energy storage devices. That is, the curtailed energy (see red area in Figure 1) can be stored and retrieved later to provide peak shaving (see hours 19:00- 21:00 in Figure 1). However, this requires significant investments (with limited usage) on behalf of the system operators and consumers and would not change the silhouette of the curve.
On the other hand, with the proper planning and operation of the system, the situation can improve and the challenges can be addressed without costly investments. For example, the energy curtailed from RES can be used to provide frequency support (virtual inertia, frequency containment reserves, etc.) during under-frequency events [3]. This support can allow for avoiding the synchronisation of conventional units for small demand increases and thus decrease the MSGLs. Furthermore, traditional problems associated with RES penetration, especially during low-loading conditions, can also be mitigated. Network congestion due to excessive reverse power conditions can be avoided and voltage issues can be mitigated. These benefits can potentially increase the hosting capacity of RES, since hosting capacity is mainly limited by the worst-case operation conditions that appear during low loading conditions.
While the proposed curve is currently prevailing only in low-inertia, islanded power systems, as the PV penetration increases in many countries, the net load in the mid-day will unavoidably reduce. RES curtailments might be avoided in interconnected power systems with the ability to export energy. However, the planned massive RES capacity increase will force future power systems to operate with fewer synchronised units close to their MSGLs, leading to RES curtailment and similar net-load silhouettes as in Figure 2.
Conclusions
The massive PV penetration has forced system operators to perform RES curtailments to balance generation and demand during low-demand / high-RES conditions. These curtailments have changed the basic characteristics of the well-known ‘duck’ curve and resulted in the ‘dachshund dog’ curve. While this effect is dominant in islanded systems, it is expected to gradually become commonplace in most RES-dominated systems.
On the one hand, this new variation of the net load curve creates additional challenges to the system operation, including increased controllability requirements and loss of RES generation. On the other hand, it offers some benefits by mitigating problems that usually occur during low-demand / high-RES conditions.
Thumbnail & banner credit: Erda Estremera on Unsplash
- [1] P. Denholm, M. O'Connell, G. Brinkman, J. Jorgenson, ‘Overgeneration from Solar Energy in California: A Field Guide to the Duck Chart’, National Renewable Energy Laboratory, November 2015.
- [2] P. Therapontos, R. Tapakis, A. Nikolaidis, P. Aristidou, ‘Increasing RES penetration in the Cyprus Power System: Current and Future Challenges’, MEDPOWER 2022, October 2022.
- [3] P. Therapontos, R. Tapakis, P. Aristidou, ‘Assessing the Impact of Primary Frequency Support from IBRs in Low Inertia Isolates Power Systems’, IEEE General Meeting 2023, July 2023.
Suggested content