How the COVID-19 pandemic contaminated the Brazilian electric system’s operation ...
No one could have anticipated this. Since mid-March 2020, the population of large Brazilian cities are at home, stores are closed, industrial activity is greatly reduced, streets are empty, and humanity has awakened to an almost global action for survival. It should not go unnoticed that the utilities and professionals that make up the Brazilian electric sector have reacted in an incredibly amazing manner.
by Jayme Darriba Macêdo – Brazilian SC.C2 coordinator – Systems operation and control
The change in demand and its consequences for the operation
An inevitable change in the pattern and amounts of electricity consumption was to be expected. Data released by the Brazilian National Electric System Operator - ONS - shows decreases in the average daily values of energy consumed, compared to corresponding days of the previous weeks. As an example, from March 8 to 14, 2020 - as pre-isolation references - there are reductions in average daily consumption of up to 22.74% (comparison between days 04/17/2020, Friday, 03/13/2020, also Friday - see Figure 1), compared to the corresponding days in the period from March 19 to 27 April 2020.
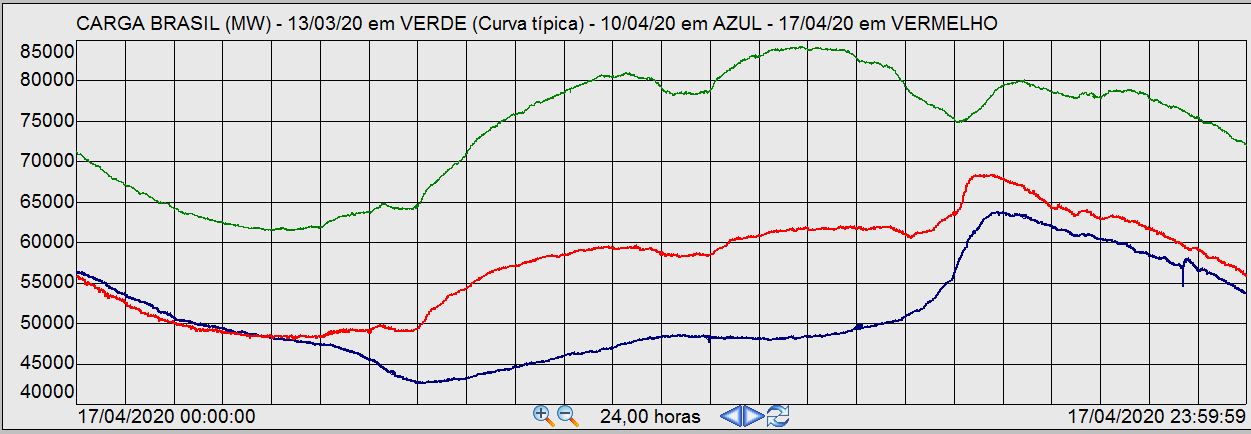
Figure 1 - Comparison of Daily Load Curves – TYPICAL (March 13 - green) x Previous Week (April 10 – Good Friday holiday - blue) x Verified (April 17 - red). (Source: ONS)
Additionally, the average demand in April 2020 was 15% lower in the Southeast / Mid-west subsystem, when compared to the average demand in March 2020 in this subsystem.
Some situations are extreme, as was Sunday, April 19, 2020, where we reached instantaneous consumption values in the Brazilian Interconnected Power System - BIPS - close to 40,000 MW, values that are lower than those seen on the previous Sunday, Easter Sunday, as shown in Figure 2:
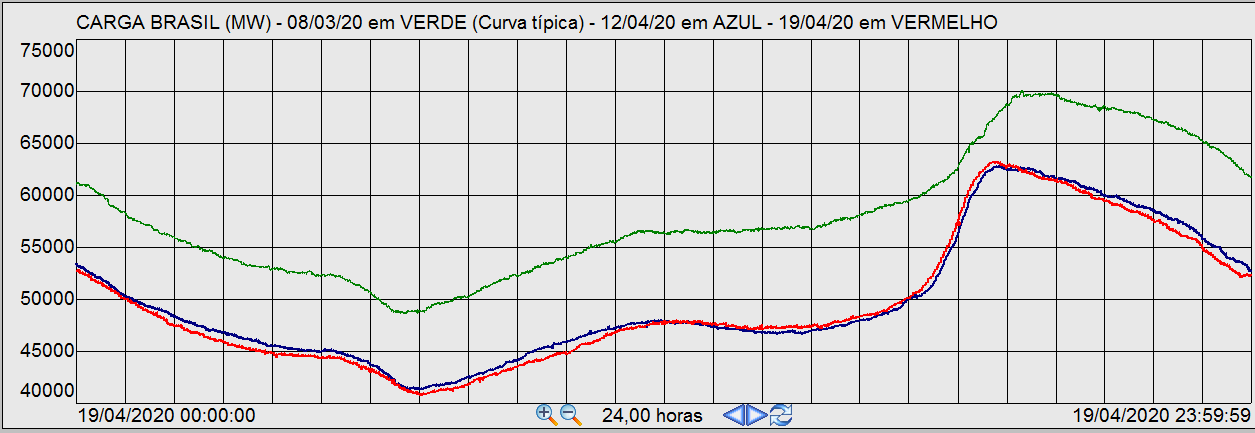
Figure 2 - Comparison of Daily Load Curves – TYPICAL (March 8 – green) x Verified (April 19 – red) x Previous week (April 12 – Easter Sunday – blue). (Source: ONS)
Less expected, the pandemic's isolation measures ‘anticipated’ typical winter energy consumption and since March 20, the peak of daily demand has been recorded in the evening, after 6 pm, different from the peak during the afternoon that is typical in summer consumption curve. These two curves can also be seen in Figure 1 above, for March 13 with a ‘summer aspect’, and April 10 to 17, already with a ‘winter aspect’.
This declining load situation lasted more strongly during the month of April and, since May, the consumption curves have begun to show small recoveries, but still very far from pre-pandemic references.
Updating the situation, we present Figure 3 where a reference curve for the load of a typical June month can be seen, as well as the curves for two weeks of June 2020.
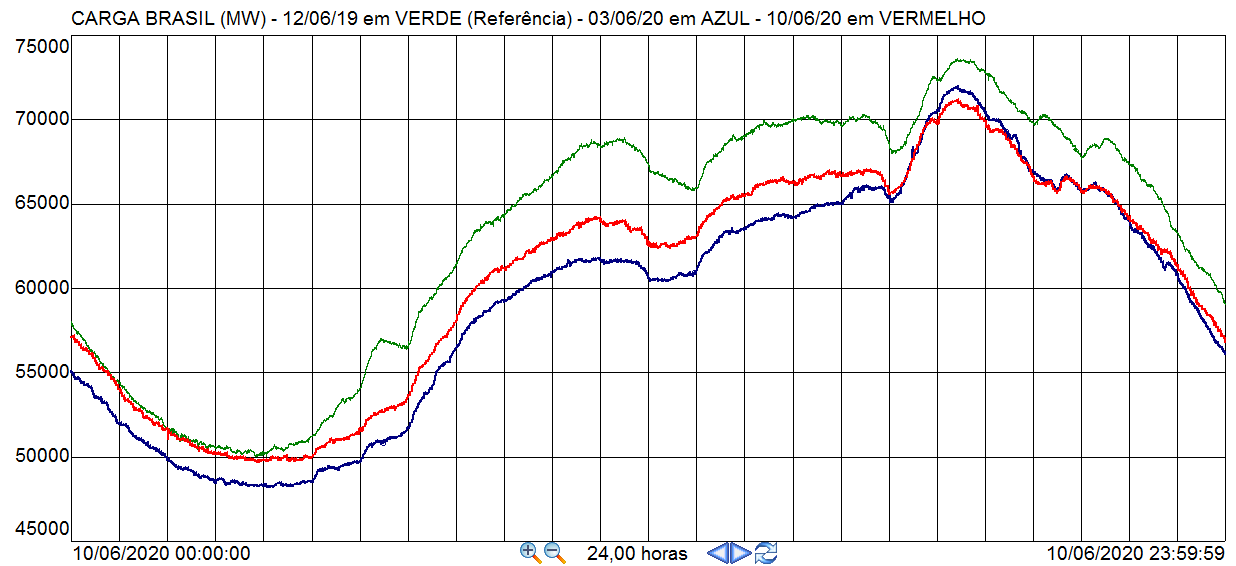
Figure 3 - Comparison of Daily Load Curves – typical (June 19, 2019 – green) x Verified (June 10, 2020 – red) x Previous week (June 3, 2020 – blue). (Source: ONS)
In the graph, we can see the recovery in average demand of around 3% from one week to the next in 2020, but still presenting average values more than 4% below the typical values of 2019.
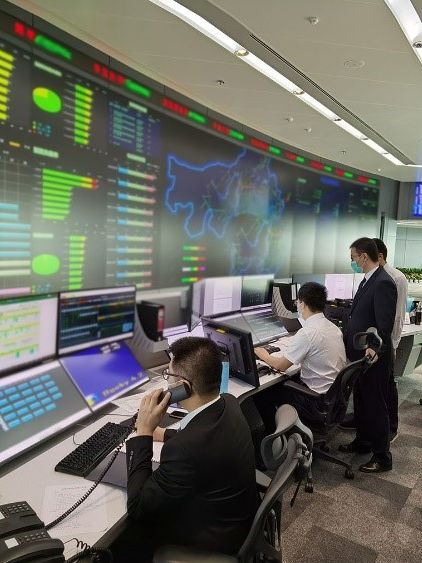
This described scenario led to changes in the technical routines in the systemic control rooms, both for ONS, controlling the operation network, and for sector utilities that are responsible for the distribution network operation.
The operation planning and programming teams were able to capture the new consumption patterns quickly and started to include these changes in the daily programming of the operation network that in turn guides the actions of the ONS control room, working together with generation, transmission and distribution agents.
Even though planning teams adapted quickly, the need for real-time teams to react in different situations, for example, taking the case of the mentioned critical low consumption day, April 19, 2020, became acute. To safely carry out voltage control, real-time operators had to open more than 20 circuits at voltages of 440 kV, 500 kV, and up to 765 kV; typically a measure only used as a last resort to reduce voltage levels, given the loss of reliability and the need to manoeuvre equipment. We must also consider that, when the point of using this resource was reached, all the necessary generation reduction had already been made. This was in addition to what was already scheduled for that date and even more unusual measures were taken, such as reducing power transmission and shutting down of some HVDC systems converters, allowing operation with fewer filters connected to the electrical system.
On the other hand, offsetting the increased work for the Control Rooms, the reduction in demand offered an added bonus: the recovery of reservoir levels for the southeast and northeast regions of Brazil.
In addition to the application of efficient policies, Brazil had one of the best rainy periods for these regions than in recent years, which has already allowed favourable recovery of large Brazilian reservoirs. With the reduction in demand seen since the third week of March 2020, we are reaching excellent levels of water (energy) storage that can be confirmed by the accumulated volume values (in the equivalent reservoir concept) already surpassing the 60% mark for Brazil in June, 2020 (see Figure 4).
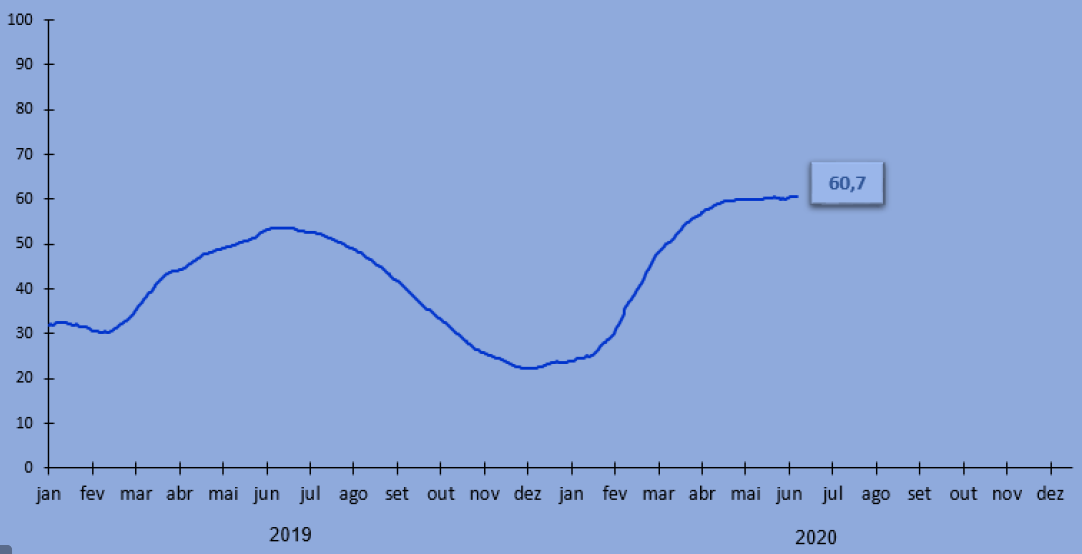
Figure 4 - Evolution of storage in the reservoirs of hydroelectric plants in Brazil - concept of Equivalent Reservoir. (Source: ONS)
For the BIPS (Brazilian Interconnected Power System) Regions, we are reaching values around 54% for the southeast, 90% for the northeast, and 84% for the northern region, by the end of the month. Only the southern region, which is suffering through an historic drought period, are we needing to apply differentiated policies and effective action by operational resources that could prevent the situation from worsening. Following is Figure 5 for the BIPS Regions:
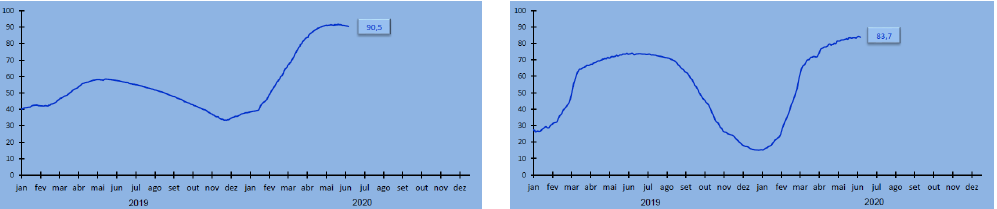
Left: North Eastern Region - Right: Northern Region
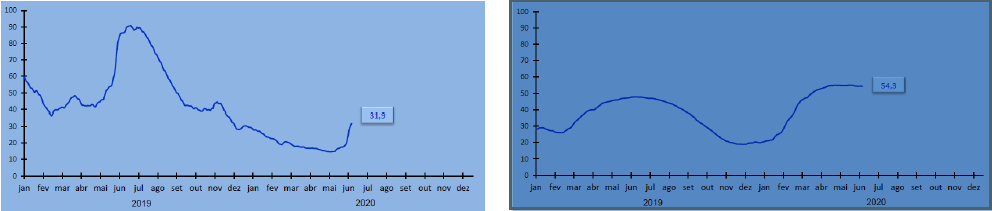
Left: Southern Region - Right: South Eastern Region
Figure 5 - Evolution of Storage in the Equivalent Reservoir for BIPS regions since January, 2019. (Source: ONS)
To conclude this technical analysis, it is worth mentioning the additional difficulty for the programming and real-time operation teams in the search to minimize waste. In a scenario of such low consumption, the task of calculating the use of accumulated and affluent energies to reduce the maximum values of the spill, remembering that today this concept does not apply only to hydroelectric plants. With the current electric sector panorama, there are inevitable consequences for the wind and photovoltaic plants that also have to provide their collaboration, with reduction of generation, in the moments when the low levels of consumption cannot absorb all the available energy.
On a low consumption day, such as the one observed on May, 31, 2020, when the minimum demand in Brazil reached 40,097 MW, it was necessary to reduce the entire hydroelectric generation to its minimum possible values, around 30,000 MW (established to maintain safe operating conditions due to the need for system inertia, the ability to recover from major events, voltage control, and other minor regional limitations). Thermal generation was also reduced to the minimum possible values reaching levels around 8,000 MW. Even in the period of very low load, the wind generation in the northeast region of Brazil (where most of this type of generation is located), and with specific programming done the previous day and with values limited in relation to the forecasted amounts, had to be further restricted, reaching reductions of up to 4,400 MW - see Figure 6.
This situation required unusual simultaneous actions for voltage control, including the shutdown of 28 transmission lines at voltages of 765 kV, 500 kV, 440 kV, 345 kV, and 230 kV, operation of HVDC systems in reduced voltage operation mode and minimum numbers of connected filters, among others.
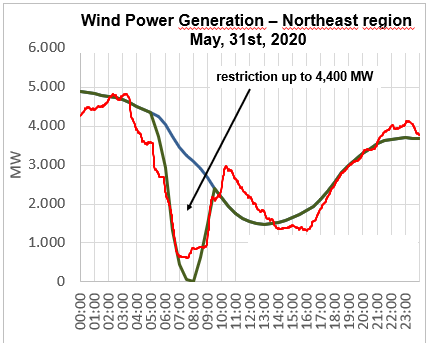
Figure 6 - Northeast wind generation on May 31, 2020.
Comparison between Forecasted (in blue), Scheduled (in green) and Verified (in red) values. (Source: ONS)
And acting, on stage and under the spotlight ... the Operators!
With absolute justice, our society has come to give much earned due recognition to our health professionals; our active heroes who risk their own health in the fight against the devastating effects of this pandemic.
It is also worth mentioning a recent interview by an ONS Operator to a newspaper in Rio de Janeiro: “I am proud to know that we provide a very important service to society. What would hospitals be without power? People at home social isolating without light? We are doing our best.”
This is the truth and motivation of actions taken by ONS and all companies operating in the electricity sector. It is necessary to ensure the availability of technicians specialized in system operation and installations, as well as equipment maintenance, in good health and in sufficient numbers to guarantee the proper and reliable functioning of our power system.
A fundamental part of this movement comes from the operators and maintenance professionals themselves, human beings who, like health professionals, give themselves for the common good, changing their life routines, partially compromising their necessary social isolation and moving away from their families for significant periods of time, at a moment in history when the union of people is so important.
Let me be allowed to dedicate this text as my form of homage and thanks to them!
The utilities realized the need to implement a series of actions to maximize the team efforts. An overview of all energy sector teams – Brazilian and worldwide – shows a concentration of common actions and a wide variety of specific decisions that were taken to safeguard the teams required to guarantee the reliable supply of energy; their health and welfare were the common denominator for them to exercise their functions.
Below is a significant set of these actions ranging from simple actions of immediate implementation to other more complex and with more sophisticated logistics that are now established and ready for more catastrophic or, at least, more complex scenarios:
- Restriction of control rooms access to the specific teams, including internal and external relationships that are indispensable only through videoconferences.
- Instructions for the teams on basic hygiene measures and safe behaviour, coexistence in the control rooms without physical contact between the members of the real-time team.
- Hygiene rules with additional instructions and availability of gel alcohol at all accesses to control rooms; console cleaning during shift changes by cleaning staff and/or members of the real-time teams, and the distribution of individual cleaning kits (alcohol gel and wipes) for the real-time teams.
- Temporary suspension of visits to the control rooms, training, and travel for the operators.
- Suspension of vacation time for real-time team members and operation center managers.
- Prohibition to leave the buildings, including for meals or during breaks.
- Monitoring health conditions: monitoring symptoms of operators and family members who live with them. Temperature check at the beginning and end of each shift period.
- Provision of 24 hour on call medical staff.
- Ease of transportation to work, especially for those without their own transport.
- Conducting a flu (H1N1) vaccination for operators.
- Conducting different types of COVID-19 tests, and repeatedly.
- Mandatory use of personal protective equipment (PPE): masks, gloves, and glasses.
- Normal and superior hygiene levels, with a hospital standard for the control rooms and other environments used by the teams.
- Possible reduction in the number of posts per shift.
- Operator certification process put on hold, with an extension of the current certification period.
- Accelerating the operator training so that they can occupy positions in the control rooms, as soon as possible.
- Maintaining fixed teams whenever possible.
- Maintaining a complete team out of rotation for technical security, being able to take advantage of existing risk cases.
- Implement longer shifts, usually 12h, with a special schedule.
- Joint operation of more than one control room, utilizing back-up control rooms and simulation training rooms.
- Research the possibility of hiring former members of the real-time teams to complement teams in cases of contamination.
- In case of infection identification: removing the team from shift schedule and quarantining them. Tracking the infected member(s) to avoid contamination of another team. Intensification of the cleaning of environments with immediate use of alternative environments, previously cleaned.
- Complete confinement of complete teams with access control rooms, including cleaning and food services.
Certainly an extensive list but which does not exhaust all possibilities and with items that allow a gradual application, and with differentiated strategic decisions by companies for each case and situation.
We highlight the point that seems to be very important regarding the intense application of COVID-19 tests on employees, guaranteeing an updated knowledge map to prevent further contamination. The difficulty of obtaining tests on the market, which is well publicized by the media, and the often abusive prices, can make the desired frequency for tests unfeasible.
Some points emerge as more painful for team members, such as vacation cancellations and total confinement for long periods. Difficult decisions like this tend to take into account the particularities of the teams themselves and the places where they are inserted. This was the case in New York City, USA, as disclosed in the media, where team confinement was executed as a preventive manner, considering the high index contamination in that metropolis.
Information sharing between teams, to guarantee seamless operations, was another important aspect that was addressed; the movement of information sharing amongst the different utilities that operate the Brazilian network as well as among international institutions. Several webinars have taken place with this central theme, allowing the dissemination of knowledge and the work of mutual support between teams that have been facing the same challenge in different degrees of intensity and in different stages of the evolution of the pandemic.
The positive side of this analysis is the record that - after almost a month and a half of social isolation and spread of pandemic – the Brazil electrical system has been maintaining its desired performance indices. Normal occurrences have happened but technical, operational, and maintenance answers were obtained, not without sacrifices and difficulties, with the same degree of efficiency normally verified.
Next steps ... the uncertainties of the future and first checks!
The pandemic evolution will progress but our technical solutions, our next steps regarding isolation and quarantine, will aid us to improve so that we may define the return to social normality.
The first signs of change we have seen are that the average daily energy consumption data in Brazil compared to the equivalent period from the previous week has shown increases since May 2020. These increases, although small - in the order of 2 to 5% - are still far from approaching the ‘reference’ weeks mentioned earlier. These variations do not have the capacity to bring back the old system operation routine, but they do guarantee its usual dynamics.
We know that we will achieve a return to a ‘new normal’. Until then and afterwards we will maintain our expectations and beliefs in our professional commitment, technical capacity, the accumulation of new knowledge, and knowledge sharing, and these shall be our powerful weapons to face the next new cycle of challenges whose success, we are sure, will guarantee the supply of electricity, a fundamental item for all modern social dynamics.
Thumbnail credit: Photo by Noah Cellura on Unsplash
Suggested content