Using citizen science to address bird electrocutions on overhead distribution networks
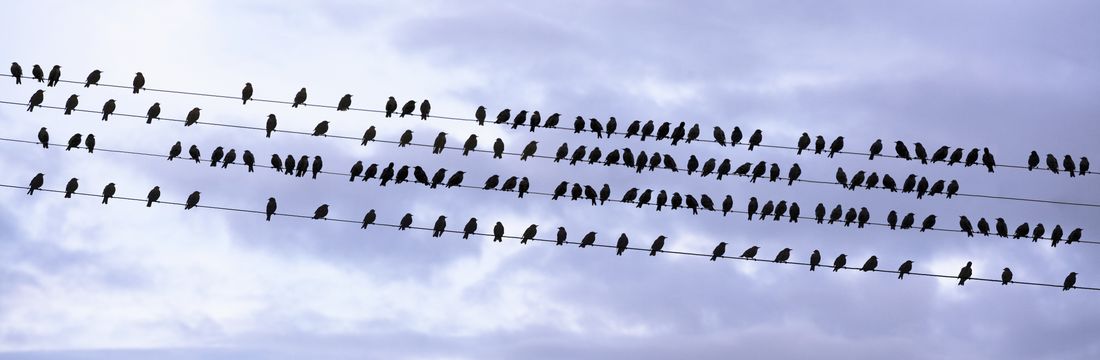
Overhead lines are widespread in South Africa’s rural areas, and are therefore also often home to vulnerable or threatened birds such as vultures and eagles. In addition to the moral and ethical imperatives of taking reasonable steps to prevent bird electrocutions, the legal requirements and cost of bird-related outages and repairs also need to be considered. This paper outlines an approach that was taken by Eskom, a South African utility, in addressing the design of new medium voltage (MV) distribution lines in vulnerable areas, including where old lines are refurbished or where individual poles are replaced.
By Andreas Beutel *, Bruce McLaren*, Constant Hoogstad**, Rudi Kruger*, Hendri Geldenhuys*
* Eskom Holdings SOC Ltd / ** Endangered Wildlife Trust (EWT)
Background
There are three ways in which birds can be electrocuted on an overhead line structure [1]:
- Phase-to-phase mode, where a bird makes simultaneous contact between two objects energized at different voltages such as phase conductors or jumpers.
- Phase-to-earth mode, where a bird makes simultaneous contact between an energized object and an earthed object, e.g. between a phase conductor or jumper and a steel structure.
- Phase-to-pole mode, where a bird makes simultaneous contact between an energized object and a sufficiently conductive wood pole. More information about this mode may be found in [1] and [2].
Mitigation against all three modes can be achieved either by placing phase conductors and jumpers in such a way that it is unlikely that birds will touch them or by insulating or covering energized objects. Since these measures come at a cost, a framework needs to be put in place for applying them in a way that reasonably balances their effectiveness with their cost. Note that the second mode (phase-to-earth) was not considered further since the vast majority of Eskom’s MV lines use wood poles; however where steel or other conductive poles are likely to be introduced, specific mitigation measures will need to be developed.
Approach
Geographic information system (GIS) software was used to plot a bird sensitivity map, which was compiled by dividing the country up into pentads (squares) of 5’ by 5’ (5 minutes by 5 minutes or about 9 km by 9 km) and assigning a value to each pentad depending on the following:
- Species distribution as compiled by the South African Bird Atlas Project (SABAP2) [3], which is a citizen science project that is a partnership between the Animal Demography Unit at the University of Cape Town, Birdlife South Africa and the South African National Biodiversity Institute. Species movements and the presence of known, active and historical nesting sites (and buffers around the nests) were also included.
- Modelled suitable habitat using Maximum Entropy ecological niche modelling using the computer software MaxEnt. Several references in scientific and popular literature were used, including [4]
- The presence of formally protected areas and Important Bird and Biodiversity Areas (IBAs).
- The locations of previously-recorded power line incidents.
Bird species included are red-listed species at risk of electrocution, cf. collision, and are White-backed vulture, Lappet-faced vulture, Cape Vulture, Bearded Vulture, Martial Eagle, Verreaux’s Eagle, Southern Banded Snake Eagle and Southern Ground-Hornbill. The resultant bird sensitivity map is shown in Figure 1.
A second map, where a “distance from the coast” value was assigned to each pentad, was created. A layer around the coast was generated whereby at least one pentad was always present, giving a layer of approximately 15 km on average. The purpose of this map is to express the probability of the risk increasing due to the wood of the structure and a bird seated on the structure becoming more conductive due to surface wetting caused by marine pollution. A third map was also created, for rain days recorded over five years; this map estimates the probability of the risk increasing due to the wood of the structure and a bird becoming more conductive due to surface wetting caused by rain.
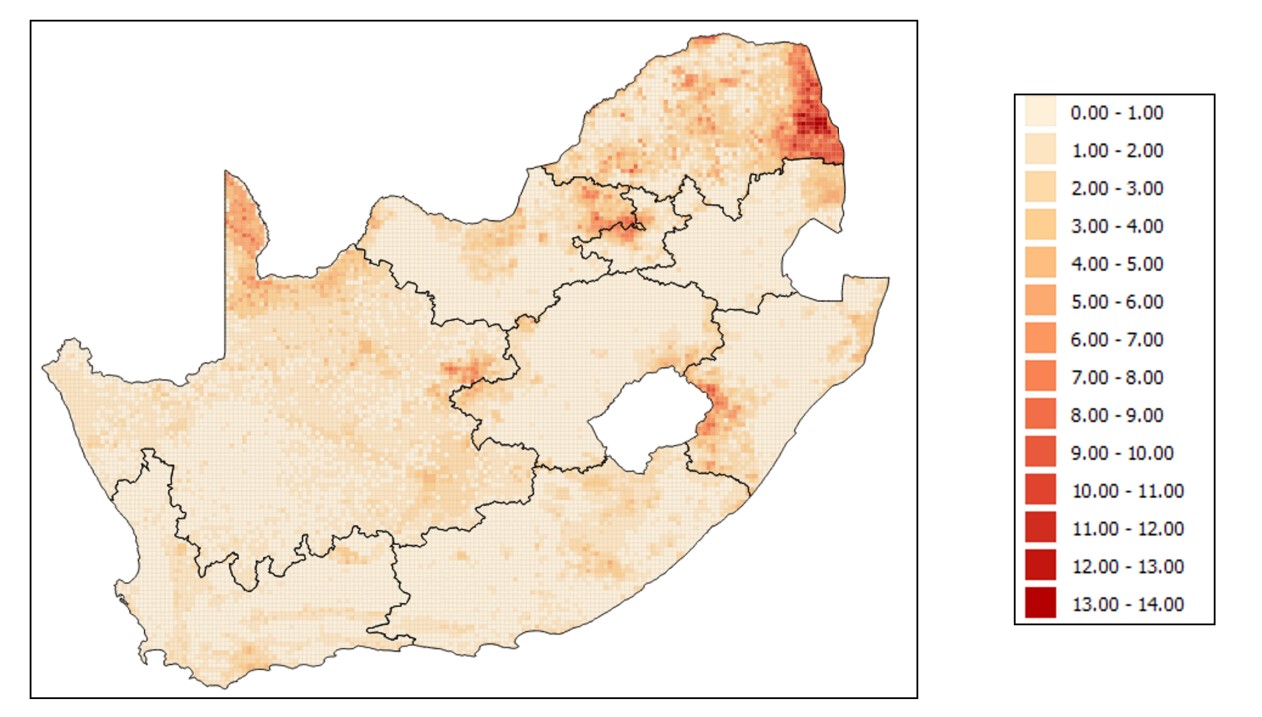
Figure 1 - Bird electrocution sensitivity map using data compiled by the South African Bird Atlas Project (SABAP2)
Results
To determine risk of phase-to-phase electrocution, the bird sensitivity map was used on its own since wetting is not expected to affect the risk. Phase-to-pole electrocution risk was calculated by combining the three maps by calculating a percentile combined risk for each pentad; assigning an 80% weighting to bird sensitivity and 10% to each of the other two factors gave a map that is reasonable from both engineering and environmental perspectives. This approach was tested by comparing with known bird fatality sites.
The next step was to set thresholds, including and above which would signify high risk areas. Different selections were tried, with the aim of finding values that result in practically implementable maps. For the phase-to-phase map of Figure 1 the threshold was chosen as 3 and for the phase-to-earth map 0.7 (out of 1) was chosen. The end result is two maps that are almost identical, allowing one map to be used for both phase-to-phase and phase-to-pole modes. This map, which includes smoothing of boundaries and removal of scattered pentads to make it more manageable, is shown in Figure 2. Some important conservation areas (and surrounds) are labelled, showing that the highest risk areas have been adequately identified.
Mitigation measures can then be implemented in the areas identified in Figure 2 using the principles listed earlier. The actual measures chosen depend on the structure configuration used in the particular area.
Discussion
The results of a study performed to identify priority areas for application of bird protection measures have shown that there is little difference in the risk between mitigating to protect birds from phase-to-phase and phase-to-pole electrocution on wood pole distribution lines because bird sensitivity is the main factor that should be taken into account, with climatic effects making relatively little difference. This is true because mitigation of phase-to-pole mode is only required for younger poles as wood conductivity increases with age [1,2] while phase-to-phase mode requires mitigation irrespective of the pole age.
The usefulness of the map is directly dependent on the quality of the data used and it is very difficult to obtain a “perfect” map of this data due to the practical difficulties. Local knowledge and experience is therefore invaluable in deciding the final risk assigned to a particular line, e.g. by taking into account localized concentrations of vulnerable species that may occur and are difficult to take into account in a map of an area as large as South Africa. It should also be noted that areas that are not identified as high risk are not necessarily low risk – they only have a lower risk relative to the highlighted areas.
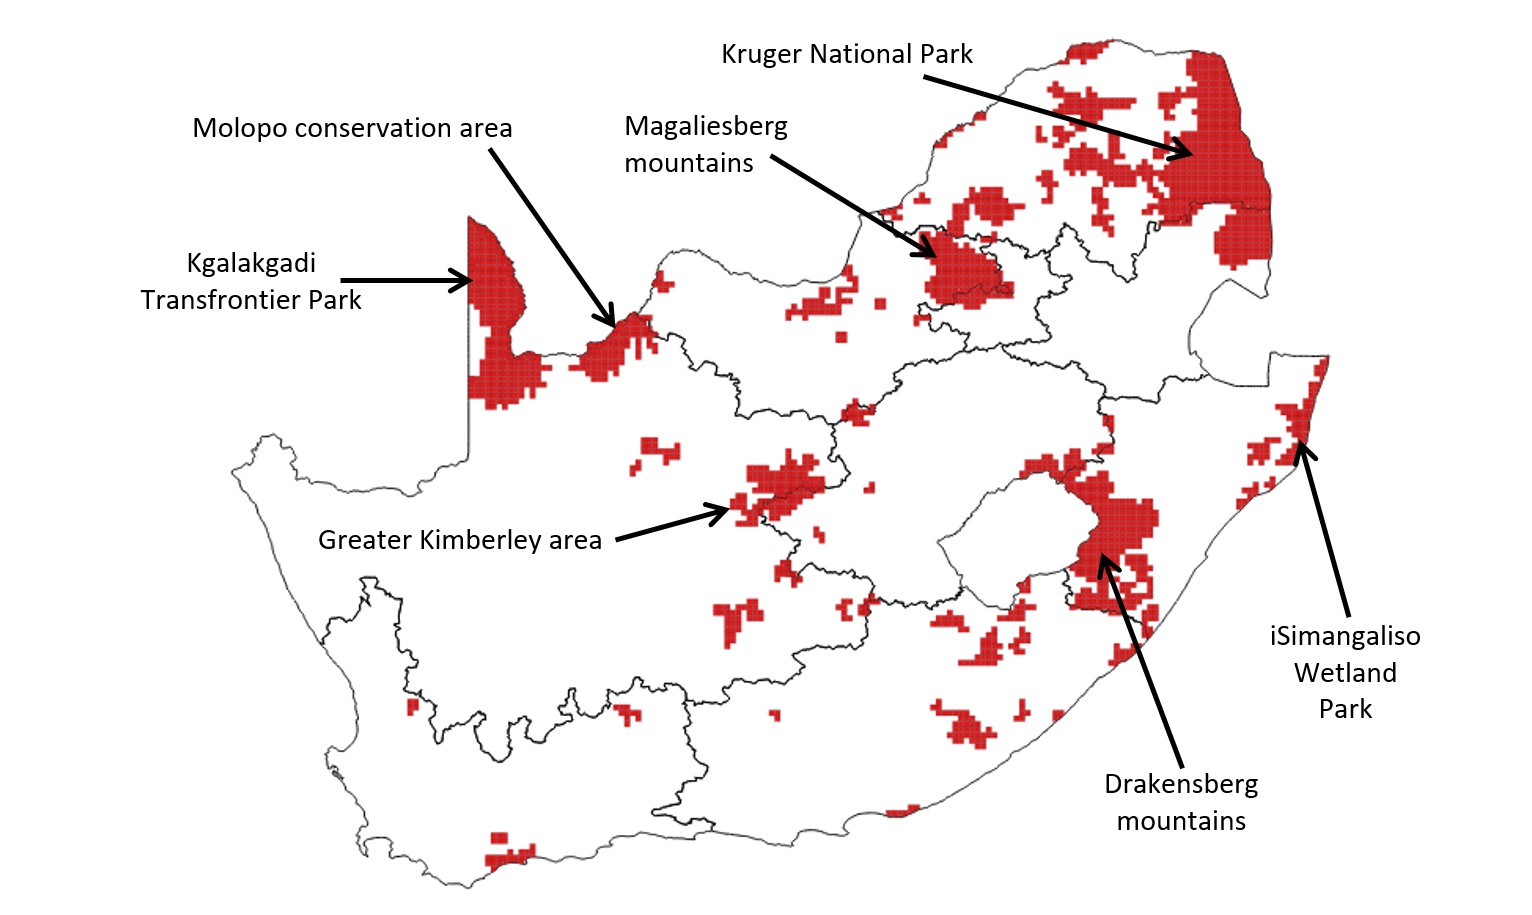
Figure 2 - Map showing areas with highest risk of bird electrocution on MV networks
Acknowledgements
The assistance of Koos Kraftt (since retired from Eskom) and Mattheuns Pretorius of EWT with compilation of the bird sensitivity map is acknowledged.
- [1] A. Beutel, B. McLaren, H. Geldenhuys, M. Murison, C. Hoogstad, N. Khoza, M. Mathebula, J. Van Coller, R. Branfield, R. Kruger, “Electrical Model of Phase-to-Woodpole Bird Electrocution”, Africa Research Journal, South African Institute of Electrical Engineers, Vol.110 (3), Sep 2019, pp. 125-135.
- [2] A. Beutel, B. McLaren, H. Geldenhuys, J. Van Coller, C. Hoogstad, N. Khoza, R. Kruger, R. Branfield, “Design of MV overhead lines to maximise bird safety”, Accepted for the 24th International Conference on Electricity Distribution (CIRED 2017), Paper 0272, Jun 2017.
- [3] Southern African Bird Atlas Project 2, available online at sabap2.birdmap.africa/species_list.php.
- [4] [4] Hijmans, R., Cameron, S., Parra, J., Jones, P., & Jarvis, A. (2005). Very high resolution interpolated climate surfaces for global land areas. International Journal of Climatology, 25, 1965-1978. [5] SANBI. (2015). 2013-2014 South African Nartional Land-Cover Dataset. Pretoria: South African National Biodiversity Institute. [6] Rutherford, M. (1980). Annual plant production-precipitation relations in arid and semiarid regions. South African Journal of Science, 76, 53-56. [7] Mucina, L., Rutherford, M., & Powrie, L. (Eds.). (2011). The Vegetation of South Africa, Lesotho and Swaziland (reprint). Strelitzia 19: South African National Biodiversity Institute. Pretoria. [8] Nel, J., Murray, K., Maherry, A., Petersen, C., Roux, D., Driver, A., Nienaber, S. (2011). Technical Report for the National Freshwater Ecosystem Priority Areas project. Pretoria: WRC Report No. 1801/2/11. [9] Acocks, J. (1988). Veld Types of South Africa. Memoirs of the Botanical Survey of South Africa, 57. [10] Crop Census, Western Cape Dept. Agriculture, 2013
Suggested content